2D maze path solver visualizer implemented with python

Overview

Maze PathFinder Visualizer implemented in Python

How to use

Download:

git clone https://github.com/ss892714028/Maze-PathFinder-Visualization-Python

Install required Libraries

pip install -r requirements.txt

Settings

Go to config.py and change settings.

  • 'w': width of the board
  • 'h': height of the board
  • 'algo':'bfs' for Breadth first search
  • 'algo':'dfs' for Depth first search
  • 'algo':'astar' for A*

Run the visualization

python ./src/drawer.py
  • The first two left clicks on the board initialize start and end node
  • Click or click and drag to create obstacles
  • Press space bar and see the algorithm takes off!

Symbols

  • "@": Start and end node
  • "#": Obstacles
  • "*": Visited node
  • "+": Path

Contributions

All contributions are welcome. :)

Algorithm Implemented

  • BFS (unweighted Dijastra)
  • DFS
  • ASTAR (A*)

Breadth First Search (unweighted Dijkstra)

Breadth First Search is unweighted and guarantee a optimal path. BFS

Depth First Search

Depth First Search is unweighted and does not guarantee a optimal path. DFS

Astar (A*)

A* is weighted and guarantee a optimal path.
A* easy A*

You might also like...
A python visualization of the A* path finding algorithm

A python visualization of the A* path finding algorithm. It allows you to pick your start, end location and make obstacles and then view the process of finding the shortest path. You can also choose to include or exclude diagonal movement.

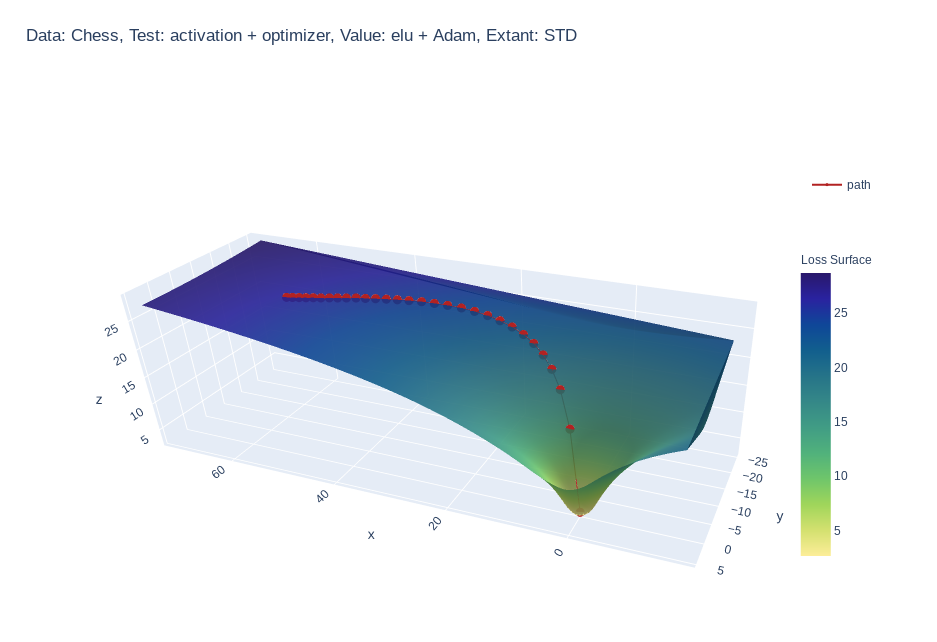
Create 3d loss surface visualizations, with optimizer path. Issues welcome!

MLVTK A loss surface visualization tool Simple feed-forward network trained on chess data, using elu activation and Adam optimizer Simple feed-forward

Fastest Gephi's ForceAtlas2 graph layout algorithm implemented for Python and NetworkX

ForceAtlas2 for Python A port of Gephi's Force Atlas 2 layout algorithm to Python 2 and Python 3 (with a wrapper for NetworkX and igraph). This is the

The visual framework is designed on the idea of module and implemented by mixin method

Visual Framework The visual framework is designed on the idea of module and implemented by mixin method. Its biggest feature is the mixins module whic

Simple plotting for Python. Python wrapper for D3xter - render charts in the browser with simple Python syntax.

PyDexter Simple plotting for Python. Python wrapper for D3xter - render charts in the browser with simple Python syntax. Setup $ pip install PyDexter

Visual Python is a GUI-based Python code generator, developed on the Jupyter Notebook environment as an extension.

Visual Python is a GUI-based Python code generator, developed on the Jupyter Notebook environment as an extension.

A Python Binder that merge 2 files with any extension by creating a new python file and compiling it to exe which runs both payloads.

Update ! ANONFILE MIGHT NOT WORK ! About A Python Binder that merge 2 files with any extension by creating a new python file and compiling it to exe w

Declarative statistical visualization library for Python

Altair http://altair-viz.github.io Altair is a declarative statistical visualization library for Python. With Altair, you can spend more time understa

Interactive Data Visualization in the browser, from  Python
Interactive Data Visualization in the browser, from Python

Bokeh is an interactive visualization library for modern web browsers. It provides elegant, concise construction of versatile graphics, and affords hi

Releases(v0.1)
Example scripts for generating plots of Bohemian matrices

Bohemian Eigenvalue Plotting Examples This repository contains examples of generating plots of Bohemian eigenvalues. The examples in this repository a

Bohemian Matrices 5 Nov 12, 2022
Python script to generate a visualization of various sorting algorithms, image or video.

sorting_algo_visualizer Python script to generate a visualization of various sorting algorithms, image or video.

146 Nov 12, 2022
LinkedIn connections analyzer

LinkedIn Connections Analyzer 🔗 https://linkedin-analzyer.herokuapp.com Hey hey 👋 , welcome to my LinkedIn connections analyzer. I recently found ou

Okkar Min 5 Sep 13, 2022
GUI for visualization and interactive editing of SMPL-family body models ie. SMPL, SMPL-X, MANO, FLAME.

Body Model Visualizer Introduction This is a simple Open3D-based GUI for SMPL-family body models. This GUI lets you play with the shape, expression, a

Muhammed Kocabas 207 Jan 01, 2023
Automate the case review on legal case documents and find the most critical cases using network analysis

Automation on Legal Court Cases Review This project is to automate the case review on legal case documents and find the most critical cases using netw

Yi Yin 7 Dec 28, 2022
PyFlow is a general purpose visual scripting framework for python

PyFlow is a general purpose visual scripting framework for python. State Base structure of program implemented, such things as packages disco

1.8k Jan 07, 2023
These data visualizations were created for my introductory computer science course using Python

Homework 2: Matplotlib and Data Visualization Overview These data visualizations were created for my introductory computer science course using Python

Sophia Huang 12 Oct 20, 2022
BGraph is a tool designed to generate dependencies graphs from Android.bp soong files.

BGraph BGraph is a tool designed to generate dependencies graphs from Android.bp soong files. Overview BGraph (for Build-Graphs) is a project aimed at

Quarkslab 10 Dec 19, 2022
Visualization Library

CamViz Overview // Installation // Demos // License Overview CamViz is a visualization library developed by the TRI-ML team with the goal of providing

Toyota Research Institute - Machine Learning 67 Nov 24, 2022
Mattia Ficarelli 2 Mar 29, 2022
A guide for using Bootstrap 5 classes in Dash Bootstrap Components V1

dash-bootstrap-cheatsheet This handy interactive cheatsheet makes it easy to use the Bootstrap 5 classes with your Dash app made with the latest versi

10 Dec 22, 2022
Create a visualization for Trump's Tweeted Words Using Python

Data Trump's Tweeted Words This plot illustrates twitter word occurences. We already did the coding I needed for this plot, so I was very inspired to

7 Mar 27, 2022
A simple project on Data Visualization for CSCI-40 course.

Simple-Data-Visualization A simple project on Data Visualization for CSCI-40 course - the instructions can be found here SAT results in New York in 20

Hugo Matousek 8 Oct 27, 2021
Voilà, install macOS on ANY Computer! This is really and magic easiest way!

OSX-PROXMOX - Run macOS on ANY Computer - AMD & Intel Install Proxmox VE v7.02 - Next, Next & Finish (NNF). Open Proxmox Web Console - Datacenter N

Gabriel Luchina 654 Jan 09, 2023
A python script to visualise explain plans as a graph using graphviz

README Needs to be improved Prerequisites Need to have graphiz installed on the machine. Refer to https://graphviz.readthedocs.io/en/stable/manual.htm

Edward Mallia 1 Sep 28, 2021
A set of three functions, useful in geographical calculations of different sorts

GreatCircle A set of three functions, useful in geographical calculations of different sorts. Available for PHP, Python, Javascript and Ruby. Live dem

72 Sep 30, 2022
Param: Make your Python code clearer and more reliable by declaring Parameters

Param Param is a library providing Parameters: Python attributes extended to have features such as type and range checking, dynamically generated valu

HoloViz 304 Jan 07, 2023
Friday Night Funkin - converts a chart from 4/4 time to 6/8 time, or from regular to swing tempo.

Chart to swing converter As seen in https://twitter.com/i_winxd/status/1462220493558366214 A program written in python that converts a chart from 4/4

5 Dec 23, 2022
Script to create an animated data visualisation for categorical timeseries data - GIF choropleth map with annotations.

choropleth_ldn Simple script to create a chloropleth map of London with categorical timeseries data. The script in main.py creates a gif of the most f

1 Oct 07, 2021
Sci palettes for matplotlib/seaborn

sci palettes for matplotlib/seaborn Installation python3 -m pip install sci-palettes Usage import seaborn as sns import matplotlib.pyplot as plt impor

Qingdong Su 2 Jun 07, 2022