view cool stats related to your discord account.

Overview

DiscoStats

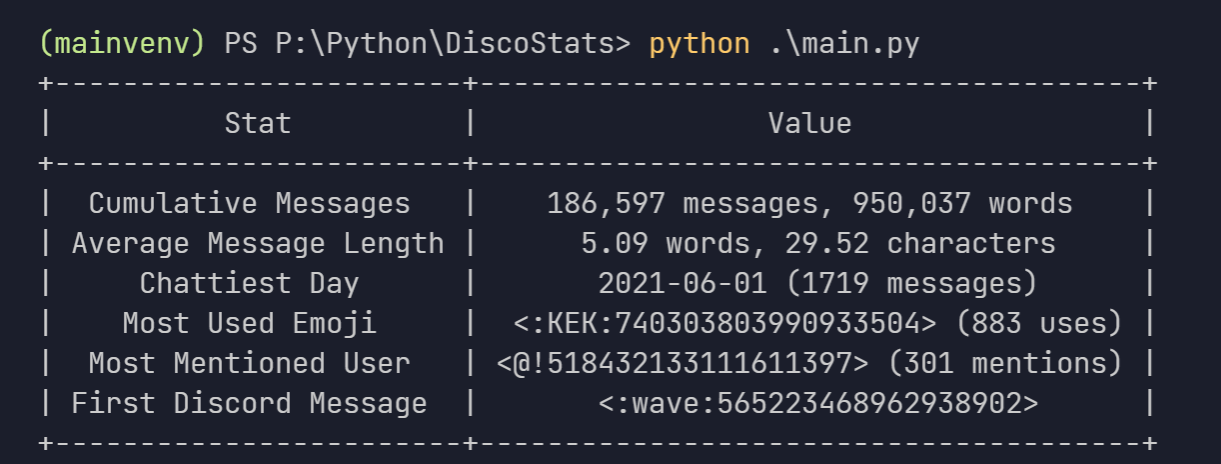
cool statistics generated using your discord data.
image

How?

DiscoStats is not a service that breaks the Discord Terms of Service or Community Guidelines. Discord has an option to request data which is what this entire application is based upon. It just scans through the lines of text of every message you have ever sent and generates statistics based upon that. As a forewarning, you need to request your data to use the application, which could potentially take up to 30 days.

Installation

⚠️ make sure you have python 3.7+ installed.

  • Clone the repository:
git clone https://github.com/ibra/DiscoStats
  • Install the dependencies:
pip install -r requirements.txt
  • Move your discord data inside the project directory, make sure it is all dumped under one "package" folder.
  • run main file:
python main.py  
  • optionally use the --dir flag to pinpoint the package location to a specific directory:
python main.py --dir otherFolder/package

Known Limitations

  • the name of servers, channels, users etc. cannot be displayed as there is no way to do that without having a bot or some sort of authorization within the server itself
  • the names of the emojis alone cannot be used because there could be conflicts between different servers, so its more convenient for them to be displayed in the <:Emoji:12345678910> format.
Owner
ibrahim hisham
student, programmer & hobbyist indie game developer
ibrahim hisham
A set of useful perceptually uniform colormaps for plotting scientific data

Colorcet: Collection of perceptually uniform colormaps Build Status Coverage Latest dev release Latest release Docs What is it? Colorcet is a collecti

HoloViz 590 Dec 31, 2022
Movies-chart - A CLI app gets the top 250 movies of all time from imdb.com and the top 100 movies from rottentomatoes.com

movies-chart This CLI app gets the top 250 movies of all time from imdb.com and

3 Feb 17, 2022
A minimalistic wrapper around PyOpenGL to save development time

glpy glpy is pyOpenGl wrapper which lets you work with pyOpenGl easily.It is not meant to be a replacement for pyOpenGl but runs on top of pyOpenGl to

Abhinav 9 Apr 02, 2022
python partial dependence plot toolbox

PDPbox python partial dependence plot toolbox Motivation This repository is inspired by ICEbox. The goal is to visualize the impact of certain feature

Li Jiangchun 723 Jan 07, 2023
Visualize the bitcoin blockchain from your local node

Project Overview A new feature in Bitcoin Core 0.20 allows users to dump the state of the blockchain (the UTXO set) using the command dumptxoutset. I'

18 Sep 11, 2022
UNMAINTAINED! Renders beautiful SVG maps in Python.

Kartograph is not maintained anymore As you probably already guessed from the commit history in this repo, Kartograph.py is not maintained, which mean

1k Dec 09, 2022
WhatsApp Chat Analyzer is a WebApp and it can be used by anyone to analyze their chat. 😄

WhatsApp-Chat-Analyzer You can view the working project here. WhatsApp chat Analyzer is a WebApp where anyone either tech or non-tech person can analy

Prem Chandra Singh 26 Nov 02, 2022
Because trello only have payed options to generate a RunUp chart, this solves that!

Trello Runup Chart Generator The basic concept of the project is that Corello is pay-to-use and want to use Trello To-Do/Doing/Done automation with gi

Rômulo Schiavon 1 Dec 21, 2021
Mattia Ficarelli 2 Mar 29, 2022
This is a small repository for me to implement my simply Data Visualisation skills through Python.

Data Visualisations This is a small repository for me to implement my simply Data Visualisation skills through Python. Steam Population Chart from 10/

9 Dec 31, 2021
A blender import/export system for Defold

defold-blender-export A Blender export system for the Defold game engine. Setup Notes There are no exhaustive documents for this tool yet. Its just no

David Lannan 27 Dec 30, 2022
Some useful extensions for Matplotlib.

mplx Some useful extensions for Matplotlib. Contour plots for functions with discontinuities plt.contour mplx.contour(max_jump=1.0) Matplotlib has pro

Nico Schlömer 519 Dec 30, 2022
Flow-based visual scripting for Python

A simple visual node editor for Python Ryven combines flow-based visual scripting with Python. It gives you absolute freedom for your nodes and a simp

Leon Thomm 3.1k Jan 06, 2023
Learn Basic to advanced level Data visualisation techniques from this Repository

Data visualisation Hey, You can learn Basic to advanced level Data visualisation techniques from this Repository. Data visualization is the graphic re

Shashank dwivedi 16 Jan 03, 2023
Schema validation just got Pythonic

Schema validation just got Pythonic schema is a library for validating Python data structures, such as those obtained from config-files, forms, extern

Vladimir Keleshev 2.7k Jan 06, 2023
Interactive Dashboard for Visualizing OSM Data Change

Dashboard and intuitive data downloader for more interactive experience with interpreting osm change data.

1 Feb 20, 2022
Fractals plotted on MatPlotLib in Python.

About The Project Learning more about fractals through the process of visualization. Built With Matplotlib Numpy License This project is licensed unde

Akeel Ather Medina 2 Aug 30, 2022
This is a learning tool and exploration app made using the Dash interactive Python framework developed by Plotly

Support Vector Machine (SVM) Explorer This app has been moved here. This repo is likely outdated and will not be updated. This is a learning tool and

Plotly 150 Nov 03, 2022
Voilà, install macOS on ANY Computer! This is really and magic easiest way!

OSX-PROXMOX - Run macOS on ANY Computer - AMD & Intel Install Proxmox VE v7.02 - Next, Next & Finish (NNF). Open Proxmox Web Console - Datacenter N

Gabriel Luchina 654 Jan 09, 2023