Visualize the bitcoin blockchain from your local node

Overview

Project Overview

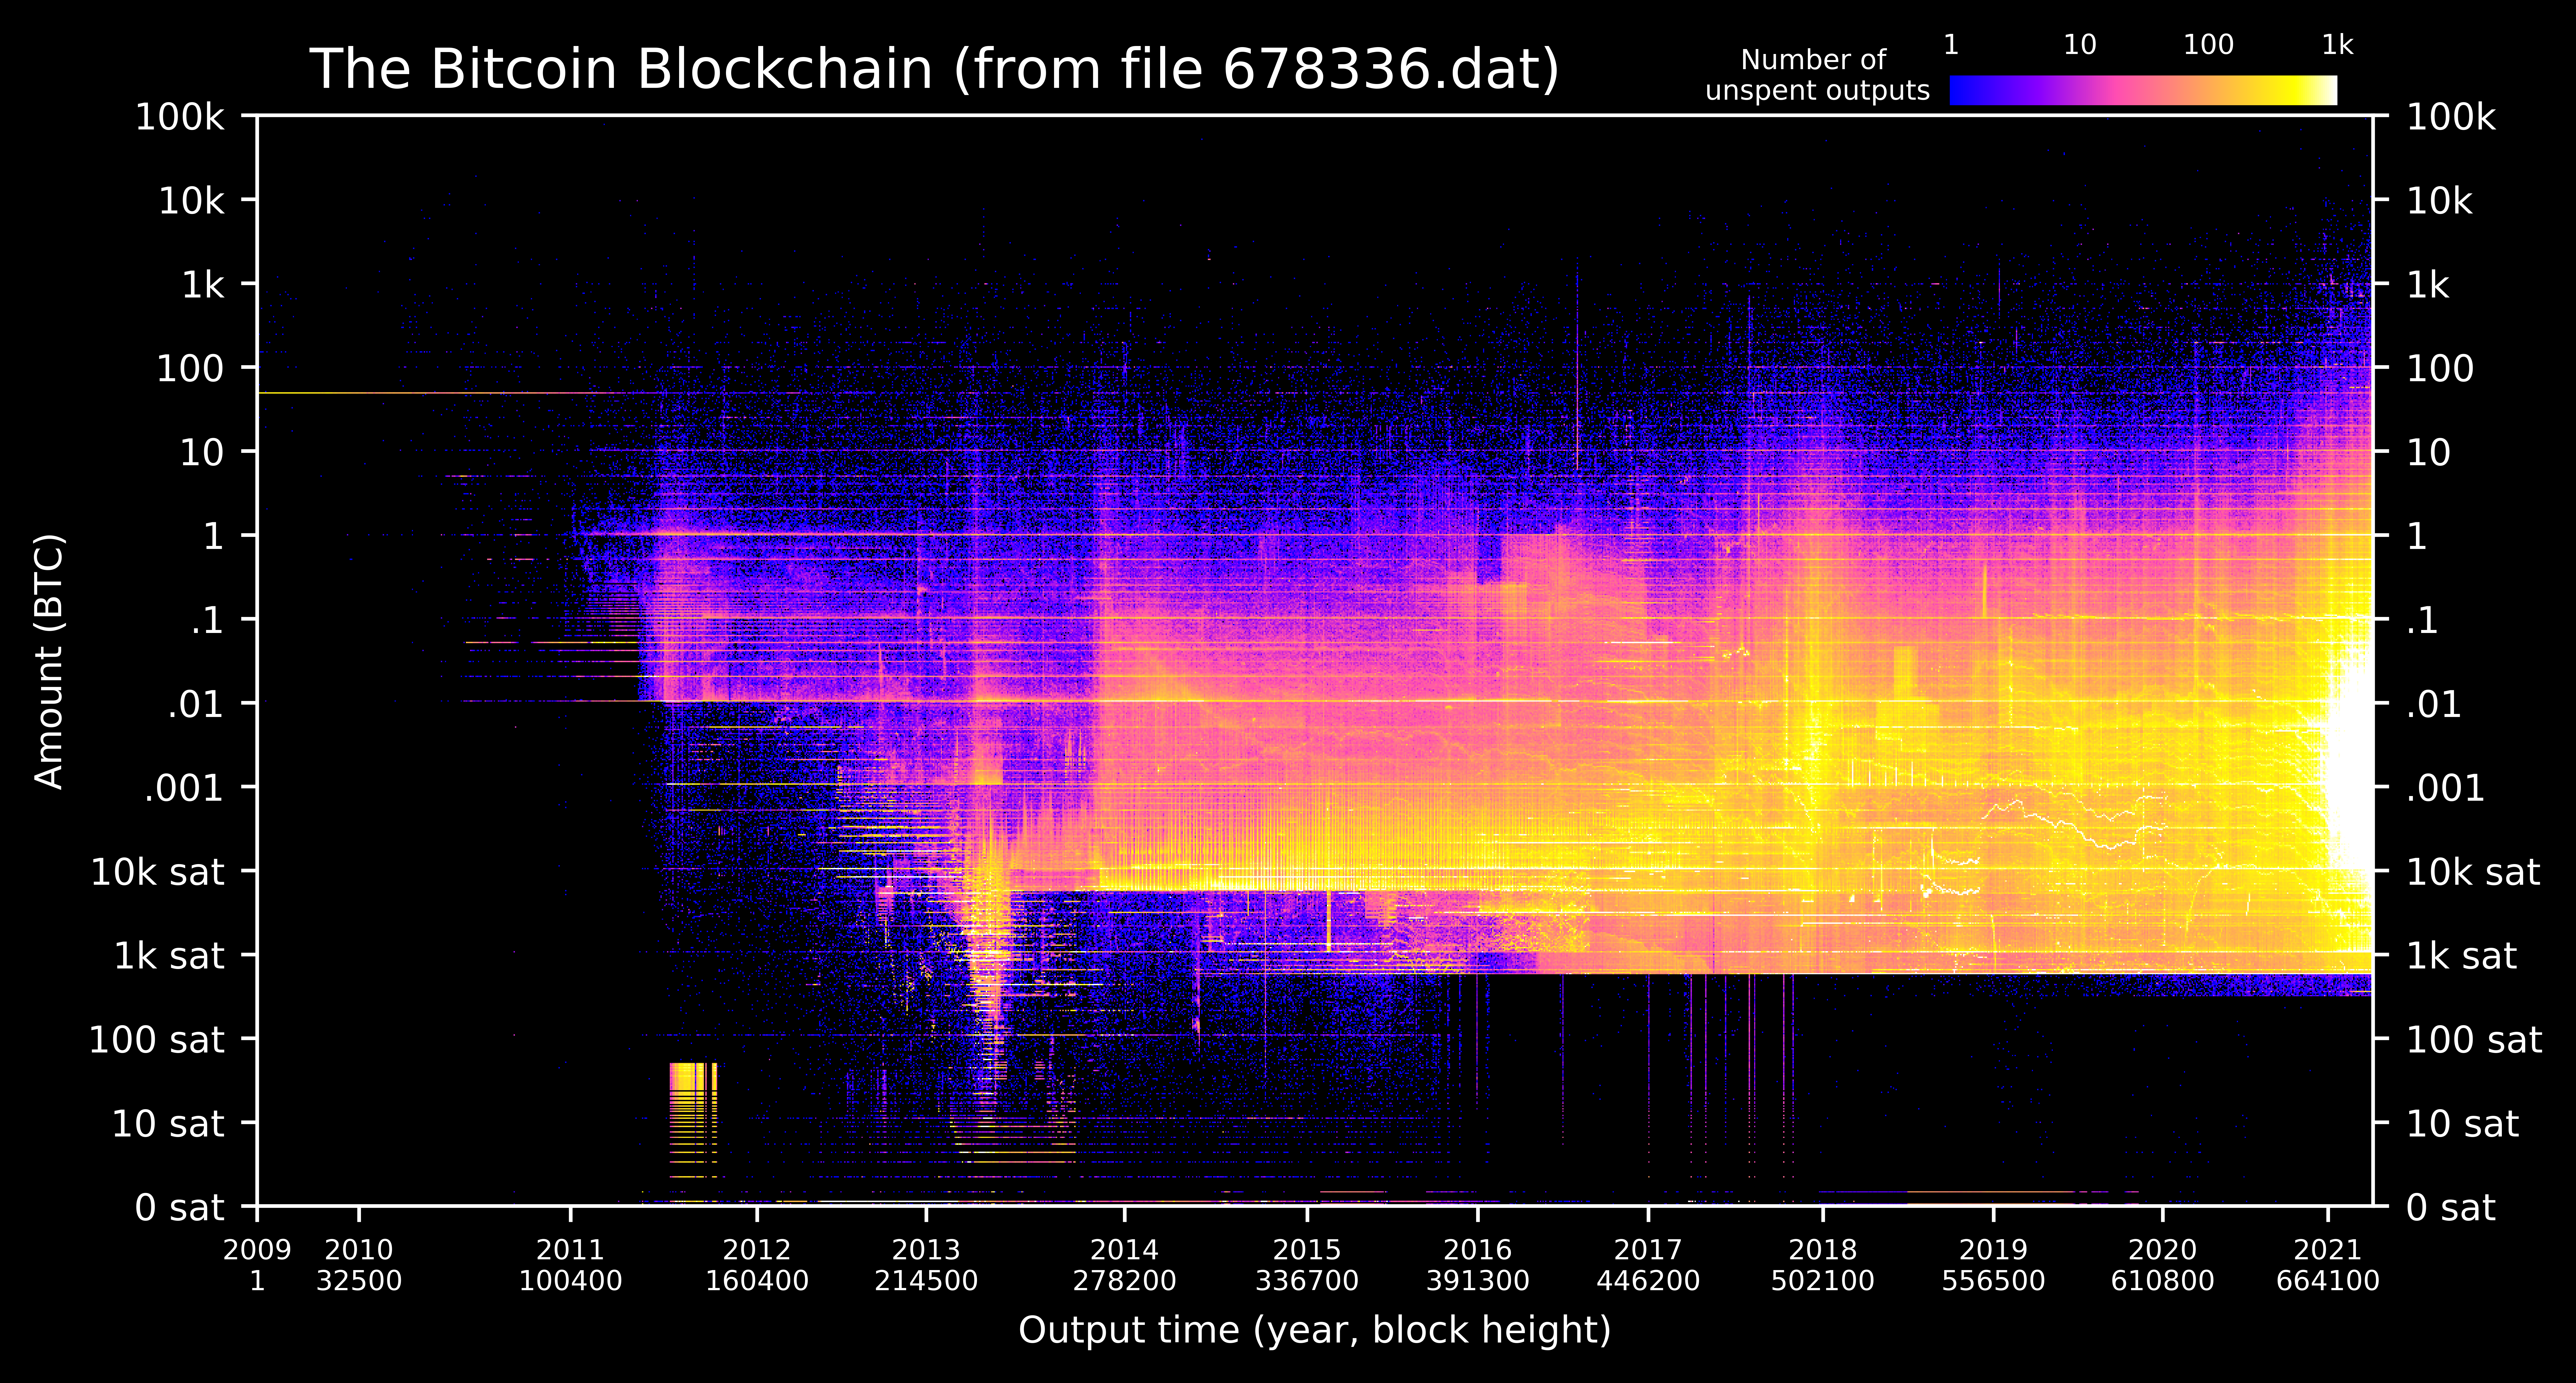
A new feature in Bitcoin Core 0.20 allows users to dump the state of the blockchain (the UTXO set) using the command dumptxoutset. I've written a python script utxo-live.py that takes the ouput of dumptxoutset and generates a heatmap of the blockchain via the UTXO set. Thus all of the active bitcoin in the blockchain is visualized in a single image from your own node.


Logo

Figure description: The heatmap is a two dimensional histogram showing the output date (x-axis), BTC amount (y-axis), and number of unspent outputs (color map) in each histogram bin. The BTC amounts on the y-axis are log scale and there are 100 bins in each log decade (e.g. 100 bins between 1 and 10 BTC). The bin size of output dates is one day. Zooming in to the image usually reveals more detail. A daily updating version of this image is running at utxo.live.

Privacy & Security

With the new dumptxouset command, the python script no longer requires an RPC password to access Core's databases. The script simply reads the dump file without interacting with Core at all. No private keys, passwords, xpubs, or wallet addresses are exchanged between Core and the python script.

Requirements

  • Bitcoin Core version 0.20 or higher
  • Python3 (comes standard on all operating systems)

Instructions for experienced users

  • Create a folder called utxo-live in a familiar location
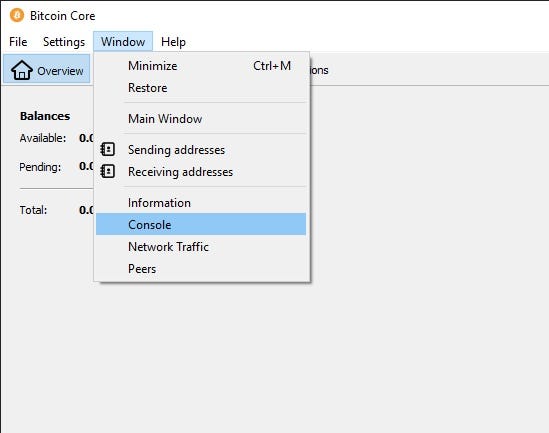
  • Dump the utxo set bitcoin-cli dumptxoutset /xxxxxx.dat where xxxxxxx is the current block height (10-20 min) (Note: bitcoin-cli doesn't ship with Core on Mac OS, use Window->Console instead)
  • Install two python dependencies python3 -m pip install numpy matplotlib
  • Download utxo-live.py to your utxo-live folder and run it python3 utxo-live.py (20 min)

Step by step instructions

  1. Make sure Bitcoin Core (version 0.20 or higher) is running and synchronized.

  2. Create a new folder called utxo-live in a familiar location on your machine (e.g. in your Documents folder).

  3. Open a terminal window and display the current folder path. Do this by:

  • Windows: open a terminal (Start -> Command Prompt) and type:
echo %cd%
  • Mac/Linux: open a terminal (Mac: Applications -> Utilities -> Terminal) and type:
pwd
  1. Navigate to the utxo-live folder using the change directory cd command. For example if you're currently in Users/Steve/ (or on Windows C:\Users\Steve\) and you've created the folder Steve/Documents/bitcoin-tools/utxo-live/ then type:
cd Document/bitcoin-tools/utxo-live/

Note: Windows sometimes requires forward slashes / instead of back slashes \.

  1. Again display the current folder (Step 3) and copy to your clipboard the full path to the utxo-live folder. We will be pasting this path into Bitcoin Core soon.

  2. Leave the terminal window momentarily, and open the Bitcoin Core console window. (Alternatively for bitcoin-cli users, open another terminal window and type the console commands in the next steps as bitcoin-cli commands.)

Open Console Pic

  1. Get the current block count by typing in the console window:
getblockcount

and hitting enter. The output will look like:

  1. Dump the current utxo set by typing in the console window:
  dumptxoutset <PATH to utxo-live>/<xxxxxx.dat>

where is copy-pasted from Step 5, and is the block count. For example if the block count is 678505, the command (for my path) is:

  dumptxoutset /Users/Steve/Documents/bitcoin-tools/utxo-live/678505.dat

If there are no error messages after hitting enter, then it's working. It will take 10-20 minutes. Look in your utxo-live folder and you should see the file being created as xxxxxx.dat.incomplete.

  1. While the utxo file is dumping, download utxo-live.py and install two python dependencies. To do this:
  • Right click on utxo-live.py, choose "Save Link As" and select the utxo-live folder.

  • In the terminal window (not the Bitcoin console), type the following command to install two python dependencies:

  python3 -m pip install numpy matplotlib

Note: you might already have these installed, but running the command won't hurt anything.

  1. If 10-20 minutes have passed, check that the utxo dump is completed. Do this in two ways:
  • Check that the file no longer has .incomplete after xxxxxx.dat
  • Check that the Bitcoin Core console displays the results of the dump as something like:

  1. If the dump file is finished and Step 9 is completed (utxo-live.py is downloaded and python dependencies were installed), then run utxo-live.py by typing in the terminal:
  python3 utxo-live.py
  1. The program will take 20-30 minutes to complete and it will update you on the progress. If there are multiple xxxxxxx.dat files in the folder, it will ask you which one you'd like to process. When finished the image is stored in the folder as utxo_heatmap_xxxxxx.png.

Acknowledgements

I'm indebted to three main projects for the code, understanding, and inspiration for this project. The python functions that parse and decode the utxo dump file were adapted from Bitcoin_Tools. I learned how Core serializes utxos from Bitcoin-UTXO-Dump . An inspiring project that visualizes changes in the UTXO set as a movie is BitcoinUtxoVisualizer .
A simple, fast, extensible python library for data validation.

Validr A simple, fast, extensible python library for data validation. Simple and readable schema 10X faster than jsonschema, 40X faster than schematic

kk 209 Sep 19, 2022
Generate visualizations of GitHub user and repository statistics using GitHub Actions.

GitHub Stats Visualization Generate visualizations of GitHub user and repository statistics using GitHub Actions. This project is currently a work-in-

Aditya Thakekar 1 Jan 11, 2022
patchwork for matplotlib

patchworklib patchwork for matplotlib test code Preparation of example plots import seaborn as sns import numpy as np import pandas as pd #Bri

Mori Hideto 185 Jan 06, 2023
The implementation of the paper "HIST: A Graph-based Framework for Stock Trend Forecasting via Mining Concept-Oriented Shared Information".

The HIST framework for stock trend forecasting The implementation of the paper "HIST: A Graph-based Framework for Stock Trend Forecasting via Mining C

Wentao Xu 111 Jan 03, 2023
Official Matplotlib cheat sheets

Official Matplotlib cheat sheets

Matplotlib Developers 6.7k Jan 09, 2023
demir.ai Dataset Operations

demir.ai Dataset Operations With this application, you can have the empty values (nan/null) deleted or filled before giving your dataset to machine le

Ahmet Furkan DEMIR 8 Nov 01, 2022
This is my favourite function - the Rastrigin function.

This is my favourite function - the Rastrigin function. What sparked my curiosity and interest in the function was its complexity in terms of many local optimum points, which makes it particularly in

1 Dec 27, 2021
Function Plotter: a simple application with GUI to plot mathematical functions

Function-Plotter Function Plotter is a simple application with GUI to plot mathe

Mohamed Nabawe 4 Jan 03, 2022
Active Transport Analytics Model (ATAM) is a new strategic transport modelling and data visualization framework for Active Transport as well as emerging micro-mobility modes

{ATAM} Active Transport Analytics Model Active Transport Analytics Model (“ATAM”) is a new strategic transport modelling and data visualization framew

Peter Stephan 0 Jan 12, 2022
The Metabolomics Integrator (MINT) is a post-processing tool for liquid chromatography-mass spectrometry (LCMS) based metabolomics.

MINT (Metabolomics Integrator) The Metabolomics Integrator (MINT) is a post-processing tool for liquid chromatography-mass spectrometry (LCMS) based m

Sören Wacker 0 May 04, 2022
An intuitive library to add plotting functionality to scikit-learn objects.

Welcome to Scikit-plot Single line functions for detailed visualizations The quickest and easiest way to go from analysis... ...to this. Scikit-plot i

Reiichiro Nakano 2.3k Dec 31, 2022
https://there.oughta.be/a/macro-keyboard

inkkeys Details and instructions can be found on https://there.oughta.be/a/macro-keyboard In contrast to most of my other projects, I decided to put t

Sebastian Staacks 209 Dec 21, 2022
Data Visualizer for Super Mario Kart (SNES)

Data Visualizer for Super Mario Kart (SNES)

MrL314 21 Nov 20, 2022
A GUI for Pandas DataFrames

PandasGUI A GUI for analyzing Pandas DataFrames. Demo Installation Install latest release from PyPi: pip install pandasgui Install directly from Githu

Adam 2.8k Jan 03, 2023
Python histogram library - histograms as updateable, fully semantic objects with visualization tools. [P]ython [HYST]ograms.

physt P(i/y)thon h(i/y)stograms. Inspired (and based on) numpy.histogram, but designed for humans(TM) on steroids(TM). The goal is to unify different

Jan Pipek 120 Dec 08, 2022
Backend app for visualizing CANedge log files in Grafana (directly from local disk or S3)

CANedge Grafana Backend - Visualize CAN/LIN Data in Dashboards This project enables easy dashboard visualization of log files from the CANedge CAN/LIN

13 Dec 15, 2022
Visualization of hidden layer activations of small multilayer perceptrons (MLPs)

MLP Hidden Layer Activation Visualization To gain some intuition about the internal representation of simple multi-layer perceptrons (MLPs) I trained

Andreas Köpf 7 Dec 30, 2022
Keir&'s Visualizing Data on Life Expectancy

Keir's Visualizing Data on Life Expectancy Below is information on life expectancy in the United States from 1900-2017. You will also find information

9 Jun 06, 2022
Movies-chart - A CLI app gets the top 250 movies of all time from imdb.com and the top 100 movies from rottentomatoes.com

movies-chart This CLI app gets the top 250 movies of all time from imdb.com and

3 Feb 17, 2022
This project is an Algorithm Visualizer where a user can visualize algorithms like Bubble Sort, Merge Sort, Quick Sort, Selection Sort, Linear Search and Binary Search.

Algo_Visualizer This project is an Algorithm Visualizer where a user can visualize common algorithms like "Bubble Sort", "Merge Sort", "Quick Sort", "

Rahul 4 Feb 07, 2022