The Metabolomics Integrator (MINT) is a post-processing tool for liquid chromatography-mass spectrometry (LCMS) based metabolomics.

Overview

CII Best Practices Github All Releases

MINT (Metabolomics Integrator)

The Metabolomics Integrator (MINT) is a post-processing tool for liquid chromatography-mass spectrometry (LCMS) based metabolomics. Metabolomics is the study of all metabolites (small chemical compounds) in a biological sample e.g. from bacteria or a human blood sample. The metabolites can be used to define biomarkers used in medicine to find treatments for diseases or for the development of diagnostic tests or for the identification of pathogens such as methicillin resistant Staphylococcus aureus (MRSA). More information on how to install and run the program can be found in the Documentation or check out the Quickstart to jump right into it.

Browser based as standalone application or server based

A demo server is available here. Be mindful, you share the server with others.

Metabolomics with Python

MINT originally started as Python project. The core of MINT is a Python class for targeted metabolomics that can be used independent of the graphical application.

from ms_mint.notebook import Mint
mint.ms_files = glob('/path/to/files/*mzML')
mint.peaklist_files = '/path/to/peaklist/file/peaklist.csv'
mint.run()
mint.results

Mint Jupyter Results

Contributions are welcome

MINT integrates open-source software and packages into a Python library for metabolomics with a browser based GUI. It is programmed by scientists for scientists to contribute to better and faster science integrating best practices of data management and computer science. Contributions are welcome that improve the efficiency of the code, bug fixes, feature implementations, security enhancements among others. If you want to contribute to MINT please send me a notification.

How to contribute

Errors, Feedback, Feature Requests

If you encounter an error, if you have a request for a new feature, or for general feedback, please open a new ticket at the issue tracker.

Code contributions

If your are up to enhance the codebase yourself, we ask you to followowing steps:

  1. fork the repository
  2. implement the new feature or bug-fix
  3. add corresponding tests
  4. run flake8
  5. submit a pull request

Code standards

Before submitting a pull request please run flake8.

Get in touch

Open an issue or join the slack channel.

Acknowledgements

This project would not be possible without the help of the open-source community. The tools and resources provided by GitHub, Docker-Hub, the Python Package Index, as well the answers from dedicated users on Stackoverflow and the Plotly community, as well as the free open-source packages used are the foundation of this project. Several people have made direct contributions to the codebase and we are extremely grateful for that.

  • @rokm refactored the specfile for Pyinstaller to create a windows package.
  • @bucknerns helped with the configuration of the versioneer file.

Last but not least, we want to thank all the users and early adopters that drive the development with feature requests and bug reports.

You might also like...
Simple spectra visualization tool for astronomers

SpecViewer A simple visualization tool for astronomers. Dependencies Python = 3.7.4 PyQt5 = 5.15.4 pyqtgraph == 0.10.0 numpy = 1.19.4 How to use py

A visualization tool made in Pygame for various pathfinding algorithms.

Pathfinding-Visualizer 🚀 A visualization tool made in Pygame for various pathfinding algorithms. Pathfinding is closely related to the shortest path

A command line tool for visualizing CSV/spreadsheet-like data

PerfPlotter Read data from CSV files using pandas and generate interactive plots using bokeh, which can then be embedded into HTML pages and served by

simple tool to paint axis x and y

simple tool to paint axis x and y

A System Metrics Monitoring Tool Built using Python3 , rabbitmq,Grafana and InfluxDB. Setup using docker compose. Use to monitor system performance with graphical interface of grafana , storage of influxdb and message queuing of rabbitmq Bioinformatics tool for exploring RNA-Protein interactions
Bioinformatics tool for exploring RNA-Protein interactions

Explore RNA-Protein interactions. RNPFind is a bioinformatics tool. It takes an RNA transcript as input and gives a list of RNA binding protein (RBP)

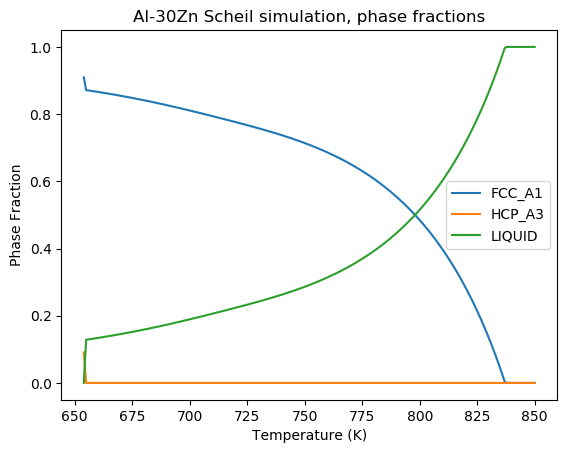
A Scheil-Gulliver simulation tool using pycalphad.

scheil A Scheil-Gulliver simulation tool using pycalphad. import matplotlib.pyplot as plt from pycalphad import Database, variables as v from scheil i

A tool for automatically generating 3D printable STLs from freely available lidar scan data.

mini-map-maker A tool for automatically generating 3D printable STLs from freely available lidar scan data. Screenshots Tutorial To use this script, g

The Spectral Diagram (SD) is a new tool for the comparison of time series in the frequency domain

The Spectral Diagram (SD) is a new tool for the comparison of time series in the frequency domain. The SD provides a novel way to display the coherence function, power, amplitude, phase, and skill score of discrete frequencies of two time series. Each SD summarises these quantities in a single plot for multiple targeted frequencies.

Comments
  • error

    error

    Hello, first of all congratulations for the application. I tried to run the application but got an error. First of all, the application is constantly updating itself in the part with dash. Secondly, when it comes to the upload data part, the following calback error appears.

    Callback error updating {"index": "ms-uploader-output", "type": "output"}, "children" TypeError: expected str, bytes or os.PathLike object, not list fn_new = P(ms_dir) / P(fn).name I couldn't run it, it seems to load the data, but it doesn't, giving these errors.

    (I guess P(fn).name doesn't see it as path.)

    opened by hilaluzunoglu 0
Releases(0.0.56)
Owner
Sören Wacker
Research Associate in the Lewis Research Group at the University of Calgary.
Sören Wacker
The implementation of the paper "HIST: A Graph-based Framework for Stock Trend Forecasting via Mining Concept-Oriented Shared Information".

The HIST framework for stock trend forecasting The implementation of the paper "HIST: A Graph-based Framework for Stock Trend Forecasting via Mining C

Wentao Xu 111 Jan 03, 2023
Rockstar - Makes you a Rockstar C++ Programmer in 2 minutes

Rockstar Rockstar is one amazing library, which will make you a Rockstar Programmer in just 2 minutes. In last decade, people learned C++ in 21 days.

4k Jan 05, 2023
Small binja plugin to import header file to types

binja-import-header (v1.0.0) Author: matteyeux Import header file to Binary Ninja types view Description: Binary Ninja plugin to import types from C h

matteyeux 15 Dec 10, 2022
paintable GitHub contribute table

githeart paintable github contribute table how to use: Functions key color select 1,2,3,4,5 clear c drawing mode mode on turn off e print paint matrix

Bahadır Araz 27 Nov 24, 2022
simple tool to paint axis x and y

simple tool to paint axis x and y

G705 1 Oct 21, 2021
`charts.css.py` brings `charts.css` to Python. Online documentation and samples is available at the link below.

charts.css.py charts.css.py provides a python API to convert your 2-dimension data lists into html snippet, which will be rendered into charts by CSS,

Ray Luo 3 Sep 23, 2021
哔咔漫画window客户端,界面使用PySide2,已实现分类、搜索、收藏夹、下载、在线观看、waifu2x等功能。

picacomic-windows 哔咔漫画window客户端,界面使用PySide2,已实现分类、搜索、收藏夹、下载、在线观看等功能。 功能介绍 登陆分流,还原安卓端的三个分流入口 分类,搜索,排行,收藏夹使用同一的逻辑,滚轮下滑自动加载下一页,双击打开 漫画详情,章节列表和评论列表 下载功能,目

1.8k Dec 31, 2022
basemap - Plot on map projections (with coastlines and political boundaries) using matplotlib.

Basemap Plot on map projections (with coastlines and political boundaries) using matplotlib. ⚠️ Warning: this package is being deprecated in favour of

Matplotlib Developers 706 Dec 28, 2022
Visual Python is a GUI-based Python code generator, developed on the Jupyter Notebook environment as an extension.

Visual Python is a GUI-based Python code generator, developed on the Jupyter Notebook environment as an extension.

Visual Python 564 Jan 03, 2023
WebApp served by OAK PoE device to visualize various streams, metadata and AI results

DepthAI PoE WebApp | Bootstrap 4 & Vue.js SPA Dashboard Based on dashmin (https:

Luxonis 6 Apr 09, 2022
NumPy and Pandas interface to Big Data

Blaze translates a subset of modified NumPy and Pandas-like syntax to databases and other computing systems. Blaze allows Python users a familiar inte

Blaze 3.1k Jan 01, 2023
2D maze path solver visualizer implemented with python

2D maze path solver visualizer implemented with python

SS 14 Dec 21, 2022
DALLE-tools provided useful dataset utilities to improve you workflow with WebDatasets.

DALLE tools DALLE-tools is a github repository with useful tools to categorize, annotate or check the sanity of your datasets. Installation Just clone

11 Dec 25, 2022
Sentiment Analysis application created with Python and Dash, hosted at socialsentiment.net

Social Sentiment Dash Application Live-streaming sentiment analysis application created with Python and Dash, hosted at SocialSentiment.net. Dash Tuto

Harrison 456 Dec 25, 2022
An interactive UMAP visualization of the MNIST data set.

Code for an interactive UMAP visualization of the MNIST data set. Demo at https://grantcuster.github.io/umap-explorer/. You can read more about the de

grant 70 Dec 27, 2022
A TileDB backend for xarray.

TileDB-xarray This library provides a backend engine to xarray using the TileDB Storage Engine. Example usage: import xarray as xr dataset = xr.open_d

TileDB, Inc. 14 Jun 02, 2021
Simple implementation of Self Organizing Maps (SOMs) with rectangular and hexagonal grid topologies

py-self-organizing-map Simple implementation of Self Organizing Maps (SOMs) with rectangular and hexagonal grid topologies. A SOM is a simple unsuperv

Jonas Grebe 1 Feb 10, 2022
YOPO is an interactive dashboard which generates various standard plots.

YOPO is an interactive dashboard which generates various standard plots.you can create various graphs and charts with a click of a button. This tool uses Dash and Flask in backend.

ADARSH C 38 Dec 20, 2022
A GUI for Pandas DataFrames

About Demo Installation Usage Features More Info About PandasGUI is a GUI for viewing, plotting and analyzing Pandas DataFrames. Demo Installation Ins

Adam Rose 2.8k Dec 24, 2022
Realtime Web Apps and Dashboards for Python and R

H2O Wave Realtime Web Apps and Dashboards for Python and R New! R Language API Build and control Wave dashboards using R! New! Easily integrate AI/ML

H2O.ai 3.4k Jan 06, 2023