A Scheil-Gulliver simulation tool using pycalphad.

Overview

scheil

A Scheil-Gulliver simulation tool using pycalphad.

import matplotlib.pyplot as plt
from pycalphad import Database, variables as v
from scheil import simulate_scheil_solidification

# setup the simulation parameters
dbf = Database('alzn_mey.tdb')
comps = ['AL', 'ZN', 'VA']
phases = sorted(dbf.phases.keys())

liquid_phase_name = 'LIQUID'
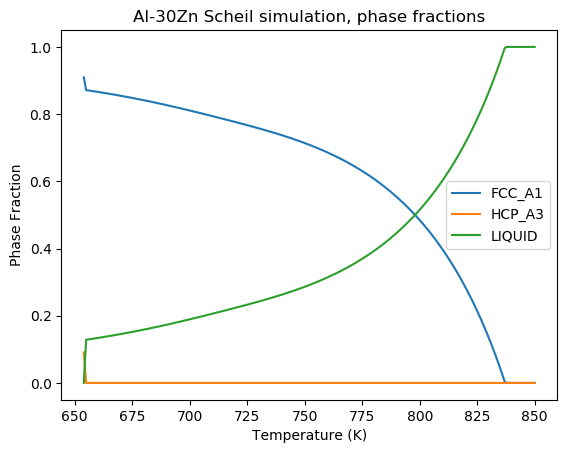
initial_composition = {v.X('ZN'): 0.3}
start_temperature = 850

# perform the simulation
sol_res = simulate_scheil_solidification(dbf, comps, phases, initial_composition, start_temperature, step_temperature=1.0)

# plot the result
for phase_name, amounts in sol_res.cum_phase_amounts.items():
    plt.plot(sol_res.temperatures, amounts, label=phase_name)
plt.plot(sol_res.temperatures, sol_res.fraction_liquid, label='LIQUID')
plt.ylabel('Phase Fraction')
plt.xlabel('Temperature (K)')
plt.title('Al-30Zn Scheil simulation, phase fractions')
plt.legend(loc='best')
plt.show()

Phase fraction evolution during a Scheil simulation of Al-30Zn

Installation

pip (recommended)

scheil is suggested to be installed from PyPI.

pip install scheil

Anaconda

conda install -c conda-forge scheil

Development versions

To install an editable development version with pip:

git clone https://github.com/pycalphad/scheil.git
cd scheil
pip install --editable .[dev]

Upgrading scheil later requires you to run git pull in this directory.

Run the automated tests using

pytest

Theory

Uses classic Scheil-Gulliver theory (see G.H. Gulliver, J. Inst. Met. 9 (1913) 120–157 and Scheil, Zeitschrift Für Met. 34 (1942) 70–72.) with assumptions of

  1. Perfect mixing in the liquid
  2. Local equilibrium between solid and liquid
  3. No diffusion in the solid

Getting Help

For help on installing and using scheil, please join the pycalphad/pycalphad Gitter room.

Bugs and software issues should be reported on GitHub.

License

scheil is MIT licensed. See LICENSE.

Citing

If you use the scheil package in your work, please cite the relevant version.

The following DOI, doi:10.5281/zenodo.3630656, will link to the latest released version of the code on Zenodo where you can cite the specific version that you haved used. For example, version 0.1.2 can be cited as:

Bocklund, Brandon, Bobbio, Lourdes D., Otis, Richard A., Beese, Allison M., & Liu, Zi-Kui. (2020, January 29). pycalphad-scheil: 0.1.2 (Version 0.1.2). Zenodo. http://doi.org/10.5281/zenodo.3630657
@software{bocklund_brandon_2020_3630657,
  author       = {Bocklund, Brandon and
                  Bobbio, Lourdes D. and
                  Otis, Richard A. and
                  Beese, Allison M. and
                  Liu, Zi-Kui},
  title        = {pycalphad-scheil: 0.1.2},
  month        = jan,
  year         = 2020,
  publisher    = {Zenodo},
  version      = {0.1.2},
  doi          = {10.5281/zenodo.3630657},
  url          = {https://doi.org/10.5281/zenodo.3630657}
}
Comments
  • Multicomponent systems stop prematurely

    Multicomponent systems stop prematurely

    Hi Brandon, I am trying to use pycalphad to simulate solidification behaviour of alloys 625 and Monel. I noticed that simulation ends at some temperature dependent on composition and temperature step, even if solidification is far from complete. I attach an extreme example for Monel, comparing temperature steps of 5K and 2K. The simulation with 2K stops prematurely. I noted a similar behavior with alloys 625, even if not so dramatic. Also changes in composition affects the end point.

    image image

    I attach the code and the database I am using, derived from mc_ni_v2.034.tdb Thank you very much for your help and all you did with pycalphad!

    MonelScheil.txt ARNi.txt

    opened by AndRicci 10
  • Error while simulating Ni-Al-Cr system

    Error while simulating Ni-Al-Cr system

    I am using a revised version of Ni-database from MatCalc. This database works with pycalphad 0.8.3. When I run scheil 0.1.1, I got error message: ALN: Sublattice frozenset({Species('N', 'N1')}) of (frozenset({Species('AL', 'AL1')}), frozenset({Species('N', 'N1')})) has no components in {Species('AL', 'AL1')}

    Any suggestion?

    opened by dpttw 2
  • `simulate_equilibrium_solidification` should do order/disorder checks automatically

    `simulate_equilibrium_solidification` should do order/disorder checks automatically

    Currently there are no checks for order/disorder phase name checking in simulate_equilibrium_solidification, so a order/disorder modeled phase that is in a disordered configuration will still show as the ordered phase name.

    The main challenge in making this change that the order/disorder check assumes a pycalphad LightDataset, rather than xarray Dataset.

    opened by bocklund 1
  • Performance pass

    Performance pass

    The code should be profiled and any optimizations made if possible and reasonable.

    For example, equilibrium(..., to_xarray=False) could be used, but the indexing into the LightDataset objects would have to be updated

    opened by bocklund 1
  • Multicomponent systems incorrectly terminate at peritectic reactions

    Multicomponent systems incorrectly terminate at peritectic reactions

    Peritectic-type reactions in the ternary go from L+A -> A+B, terminating the current Scheil algorithm. Section 12.8 in Hillert's Phase Equilibria, Phase Diagrams, and Phase Transformations (2nd Edition) may be insightful. Specifically, the idea below might be able to be used to determine when a peritectic region is found and how to update the composition of the liquid so that the liquidus can continue to be followed down the liquidus projection to a eutectic.

    screen shot 2019-01-02 at 2 02 47 pm
    opened by bocklund 1
  • ENH: improve handling for ordered phases

    ENH: improve handling for ordered phases

    Introduces an OrderingRecord object to track the relationship between ordered and disordered phases, replacing the old ordering code. The new ordering approach can be used for arbitrary equilibrium calculations and is used to fix #8.

    The logic for defining how to compare the disordered phases is currently the same as before, considering the site ratios to determine equivalent sublattices. I am deferring action on this with the issue filed in https://github.com/pycalphad/scheil/issues/23.

    opened by bocklund 0
  • ENH: use adaptive sampling by default

    ENH: use adaptive sampling by default

    • Points dictionaries are now created for the user by default if they are not provided.
    • Adaptive sampling does not do any "local" random sampling by default, it just adds the point from the solution
    • Don't use pycalphad.core.utils.generate_dof to create the dof_dict (it is deprecated)
    opened by bocklund 0
  • ENH: Build phase records instead of callables

    ENH: Build phase records instead of callables

    Uses the pycalphad API to pass PhaseRecord dictionaries to calculate and equilibrium to improve the tight-loop performance of equilibrium and Scheil solidification simulations https://github.com/pycalphad/pycalphad/pull/361.

    Building phase records can give a significant performance boost, roughly 10x to 100x speedup in some cases.

    opened by bocklund 0
  • BLD/MAINT: Modernize project metadata

    BLD/MAINT: Modernize project metadata

    • Add pyproject.toml
    • Switch to setuptools_scm instead of versioneer
    • Update installation instructions in README
    • Add automated deployment on Releases
    • Update docs theme to furo
    opened by bocklund 0
  • FIX: Fix removing disordered phase candidates

    FIX: Fix removing disordered phase candidates

    Fixes a regression introduced in #11, where filter_phases was introduced to remove phases that cannot be stable or phases where the disordered part is given as a candidate phase. The change in #11 made it so the disordered phase was not a part of the list of solid_phases that could form during the solidification simulations. With the disordered phase name not included in the solid_phases, the order_disorder_eq_phases function that renamed the ordered phases with disordered configurations to their disordered counterpart would lead to the phase amount of disordered configurations to not be saved.

    This PR fixes that and adds a parameterized test case that tests that the disordered phase always is accounted for regardless of whether or not the ordered phase is in the candidate phases or not.

    opened by bocklund 0
  • FIX: Force exit in equilibrium solidification after a successful binary search

    FIX: Force exit in equilibrium solidification after a successful binary search

    • Exit the equilibrium solidification while loop after a binary search, because the solidification must be converged then by definition (fixes a floating point precision issue where 0.999... < 1 caused the loop to be infinite on some platforms.
    • Update CI for pip version of pycalphad
    • Remove environment.yml development file
    • Drop Python 3.6
    opened by bocklund 0
  • Improve logic for deciding which sublattices are equivalent when checking ordering

    Improve logic for deciding which sublattices are equivalent when checking ordering

    Currently, sublattices in ordered (partitioned) phases are considered equivalent by symmetry if their site ratios are equal. This is a poor heuristic and will fail to determine that sublattices 0 and 1 are equivalent in an FCC_L12 phase with sublattice model [['A', 'B'], ['A', 'B'], ['VA']] with site ratios [0.25, 0.75, 3].

    Relevant for this fix will be the current heuristic in pycalphad models https://github.com/pycalphad/pycalphad/pull/311, and the changes that will occur as a result of fixing https://github.com/pycalphad/pycalphad/issues/345.

    opened by bocklund 0
Releases(0.1.6)
Owner
pycalphad
Computational Thermodynamics in Python
pycalphad
Automatic data visualization in atom with the nteract data-explorer

Data Explorer Interactively explore your data directly in atom with hydrogen! The nteract data-explorer provides automatic data visualization, so you

Ben Russert 65 Dec 01, 2022
A script written in Python that generate output custom color (HEX or RGB input to x1b hexadecimal)

ColorShell ─ 1.5 Planned for v2: setup.sh for setup alias This script converts HEX and RGB code to x1b x1b is code for colorize outputs, works on ou

Riley 4 Oct 31, 2021
PyFlow is a general purpose visual scripting framework for python

PyFlow is a general purpose visual scripting framework for python. State Base structure of program implemented, such things as packages disco

1.8k Jan 07, 2023
A tool for automatically generating 3D printable STLs from freely available lidar scan data.

mini-map-maker A tool for automatically generating 3D printable STLs from freely available lidar scan data. Screenshots Tutorial To use this script, g

Mike Abbott 51 Nov 06, 2022
This is a small program that prints a user friendly, visual representation, of your current bsp tree

bspcq, q for query A bspc analyzer (utility for bspwm) This is a small program that prints a user friendly, visual representation, of your current bsp

nedia 9 Apr 24, 2022
Peloton Stats to Google Sheets with Data Visualization through Seaborn and Plotly

Peloton Stats to Google Sheets with Data Visualization through Seaborn and Plotly Problem: 2 peloton users were looking for a way to track their metri

9 Jul 22, 2022
Visualize large time-series data in plotly

plotly_resampler enables visualizing large sequential data by adding resampling functionality to Plotly figures. In this Plotly-Resampler demo over 11

PreDiCT.IDLab 604 Dec 28, 2022
Automatically visualize your pandas dataframe via a single print! 📊 💡

A Python API for Intelligent Visual Discovery Lux is a Python library that facilitate fast and easy data exploration by automating the visualization a

Lux 4.3k Dec 28, 2022
Chem: collection of mostly python code for molecular visualization, QM/MM, FEP, etc

chem: collection of mostly python code for molecular visualization, QM/MM, FEP,

5 Sep 02, 2022
Data visualization electromagnetic spectrum

Datenvisualisierung-Elektromagnetischen-Spektrum Anhand des Moduls matplotlib sollen die Daten des elektromagnetischen Spektrums dargestellt werden. D

Pulsar 1 Sep 01, 2022
SummVis is an interactive visualization tool for text summarization.

SummVis is an interactive visualization tool for analyzing abstractive summarization model outputs and datasets.

Robustness Gym 246 Dec 08, 2022
Painlessly create beautiful matplotlib plots.

Announcement Thank you to everyone who has used prettyplotlib and made it what it is today! Unfortunately, I no longer have the bandwidth to maintain

Olga Botvinnik 1.6k Jan 06, 2023
股票行情实时数据接口-A股,完全免费的沪深证券股票数据-中国股市,python最简封装的API接口

股票行情实时数据接口-A股,完全免费的沪深证券股票数据-中国股市,python最简封装的API接口,包含日线,历史K线,分时线,分钟线,全部实时采集,系统包括新浪腾讯双数据核心采集获取,自动故障切换,STOCK数据格式成DataFrame格式,可用来查询研究量化分析,股票程序自动化交易系统.为量化研究者在数据获取方面极大地减轻工作量,更加专注于策略和模型的研究与实现。

dev 572 Jan 08, 2023
Visualizations of linear algebra algorithms for people who want a deep understanding

Visualising algorithms on symmetric matrices Examples QR algorithm and LR algorithm Here, we have a GIF animation of an interactive visualisation of t

ogogmad 3 May 05, 2022
基于python爬虫爬取COVID-19爆发开始至今全球疫情数据并利用Echarts对数据进行分析与多样化展示。

COVID-19-Epidemic-Map 基于python爬虫爬取COVID-19爆发开始至今全球疫情数据并利用Echarts对数据进行分析与多样化展示。 觉得项目还不错的话欢迎给一个star! 项目的源码可以正常运行,各个库的版本、数据库的建表语句、运行过程中遇到的坑以及解决方式在笔记.md中都

31 Dec 15, 2022
GUI for visualization and interactive editing of SMPL-family body models ie. SMPL, SMPL-X, MANO, FLAME.

Body Model Visualizer Introduction This is a simple Open3D-based GUI for SMPL-family body models. This GUI lets you play with the shape, expression, a

Muhammed Kocabas 207 Jan 01, 2023
RockNext is an Open Source extending ERPNext built on top of Frappe bringing enterprise ready utilization.

RockNext is an Open Source extending ERPNext built on top of Frappe bringing enterprise ready utilization.

Matheus Breguêz 13 Oct 12, 2022
Data aggregated from the reports found at the MCPS COVID Dashboard into a set of visualizations.

Montgomery County Public Schools COVID-19 Visualizer Contents About this project Data Support this project About this project Data All data we use can

James 3 Jan 19, 2022
A data visualization curriculum of interactive notebooks.

A data visualization curriculum of interactive notebooks, using Vega-Lite and Altair. This repository contains a series of Python-based Jupyter notebooks.

UW Interactive Data Lab 1.2k Dec 30, 2022
Displaying plot of death rates from past years in Poland. Data source from these years is in readme

Average-Death-Rate Displaying plot of death rates from past years in Poland The goal collect the data from a CSV file count the ADR (Average Death Rat

Oliwier Szymański 0 Sep 12, 2021