Peloton Stats to Google Sheets with Data Visualization through Seaborn and Plotly

Overview

Peloton Stats to Google Sheets with Data Visualization through Seaborn and Plotly

Problem: 2 peloton users were looking for a way to track their metrics in a way that was readable and available

Solution: this script. I personally run this at set intervals on a raspberry pi, so access to their data is usable at virtually all hours.

Here's how it works. The code relies on first having built a csv file which contains the headings of 'name', 'username', 'email', and 'password' (for Peloton). The script pulls data from this file and then logs into peloton. From there, it downloads the users CSV data with all of their workout data. For my specific needs, we only cared about cycling data (which you will notice in the code). Several calculations are performed and some clean up is completed on the dataframes. That data is then passed into the user's assigned Google Sheet (which also includes their interactive 'goal' cell used for pace calculations [this resets on the first of each year]. Since I am running on a raspberry pi, I use SMTP to send an email to each user at the end of the day with a daily wrap email.

The script utilizes several dependencies (noted in the code itself). One of the dependencies is based on the google sheets API. Information can be found here: https://developers.google.com/sheets/api

You might also like...
Productivity Tools for Plotly + Pandas

Cufflinks This library binds the power of plotly with the flexibility of pandas for easy plotting. This library is available on https://github.com/san

Custom Plotly Dash components based on Mantine React Components library

Dash Mantine Components Dash Mantine Components is a Dash component library based on Mantine React Components Library. It makes it easier to create go

 A Simple Flask-Plotly Example for NTU 110-1 DSSI Class
A Simple Flask-Plotly Example for NTU 110-1 DSSI Class

A Simple Flask-Plotly Example for NTU 110-1 DSSI Class Live Demo Prerequisites We will use Flask and Ploty to build a Flask application. If you haven'

A shimmer pre-load component for Plotly Dash

dash-loading-shimmer A shimmer pre-load component for Plotly Dash Installation Get it with pip: pip install dash-loading-extras Or maybe you prefer Pi

3D plotting and mesh analysis through a streamlined interface for the Visualization Toolkit (VTK)

PyVista Deployment Build Status Metrics Citation License Community 3D plotting and mesh analysis through a streamlined interface for the Visualization

3D plotting and mesh analysis through a streamlined interface for the Visualization Toolkit (VTK)

PyVista Deployment Build Status Metrics Citation License Community 3D plotting and mesh analysis through a streamlined interface for the Visualization

Create Badges with stats of Scratch User, Project and Studio. Use those badges in Github readmes, etc.

Scratch-Stats-Badge Create customized Badges with stats of Scratch User, Studio or Project. Use those badges in Github readmes, etc. Examples Document

 GitHub Stats Visualizations : Transparent
GitHub Stats Visualizations : Transparent

GitHub Stats Visualizations : Transparent Generate visualizations of GitHub user and repository statistics using GitHub Actions. ⚠️ Disclaimer The pro

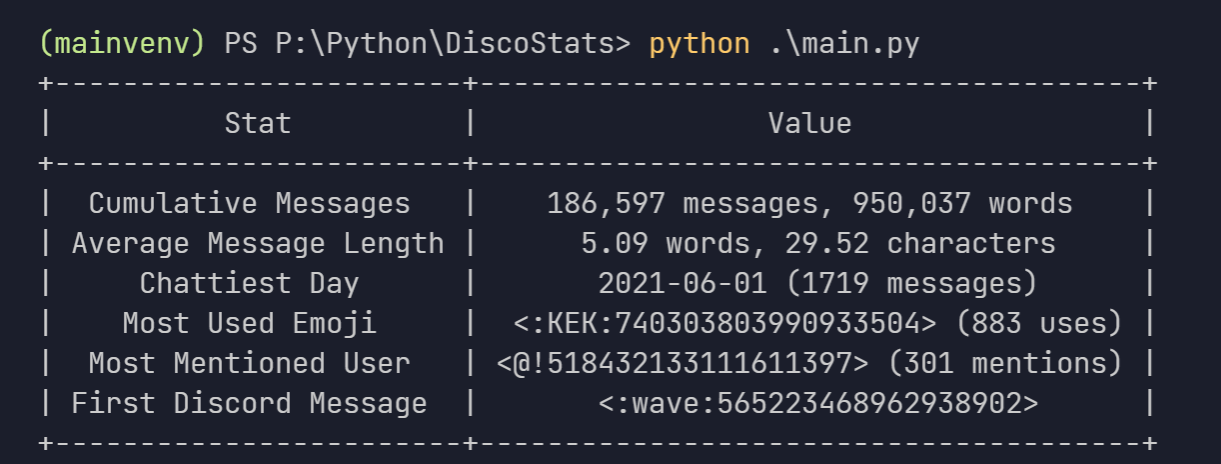
view cool stats related to your discord account.

DiscoStats cool statistics generated using your discord data. How? DiscoStats is not a service that breaks the Discord Terms of Service or Community G

Releases(v2.1.2)
  • v2.1.2(Feb 1, 2022)

    1. added a '--pause' arg to the script to facilitate the pausing for service account quota exceeded errors
    2. Initial push of a google sheet builder

    What's Changed

    • Sheet Build Initial Push by @tychaney in https://github.com/tychaney/Peloton-Data-to-Google-Sheets/pull/3

    Full Changelog: https://github.com/tychaney/Peloton-Data-to-Google-Sheets/compare/v2.1.1...v2.1.2

    Source code(tar.gz)
    Source code(zip)
  • v2.1.1(Jan 31, 2022)

    Minor bug fix from 2.1.0 Corrected the monthly pace calculation

    What's Changed

    • v 2.1.0 by @tychaney in https://github.com/tychaney/Peloton-Data-to-Google-Sheets/pull/2

    Full Changelog: https://github.com/tychaney/Peloton-Data-to-Google-Sheets/compare/v2.1.0...v2.1.1

    Source code(tar.gz)
    Source code(zip)
Generate knowledge graphs with interesting geometries, like lattices

Geometric Graphs Generate knowledge graphs with interesting geometries, like lattices. Works on Python 3.9+ because it uses cool new features. Get out

Charles Tapley Hoyt 5 Jan 03, 2022
Generate a roam research like Network Graph view from your Notion pages.

Notion Graph View Export Notion pages to a Roam Research like graph view.

Steve Sun 214 Jan 07, 2023
Visual Python is a GUI-based Python code generator, developed on the Jupyter Notebook environment as an extension.

Visual Python is a GUI-based Python code generator, developed on the Jupyter Notebook environment as an extension.

Visual Python 564 Jan 03, 2023
An adaptable Snakemake workflow which uses GATKs best practice recommendations to perform germline mutation calling starting with BAM files

Germline Mutation Calling This Snakemake workflow follows the GATK best-practice recommandations to call small germline variants. The pipeline require

12 Dec 24, 2022
A python script to visualise explain plans as a graph using graphviz

README Needs to be improved Prerequisites Need to have graphiz installed on the machine. Refer to https://graphviz.readthedocs.io/en/stable/manual.htm

Edward Mallia 1 Sep 28, 2021
plotly scatterplots which show molecule images on hover!

molplotly Plotly scatterplots which show molecule images on hovering over the datapoints! Required packages: pandas rdkit jupyter_dash ➡️ See example.

150 Dec 28, 2022
Python ts2vg package provides high-performance algorithm implementations to build visibility graphs from time series data.

ts2vg: Time series to visibility graphs The Python ts2vg package provides high-performance algorithm implementations to build visibility graphs from t

Carlos Bergillos 26 Dec 17, 2022
This is a place where I'm playing around with pandas to analyze data in a csv/excel file.

pandas-csv-excel-analysis This is a place where I'm playing around with pandas to analyze data in a csv/excel file. 0-start A very simple cheat sheet

Chuqin 3 Oct 05, 2022
ecoglib: visualization and statistics for high density microecog signals

ecoglib: visualization and statistics for high density microecog signals This library contains high-level analysis tools for "topos" and "chronos" asp

1 Nov 17, 2021
Visualize and compare datasets, target values and associations, with one line of code.

In-depth EDA (target analysis, comparison, feature analysis, correlation) in two lines of code! Sweetviz is an open-source Python library that generat

Francois Bertrand 2.3k Jan 05, 2023
A tool to plot and execute Rossmos's Formula, that helps to catch serial criminals using mathematics

Rossmo Plotter A tool to plot and execute Rossmos's Formula using python, that helps to catch serial criminals using mathematics Author: Amlan Saha Ku

Amlan Saha Kundu 3 Aug 29, 2022
2D maze path solver visualizer implemented with python

2D maze path solver visualizer implemented with python

SS 14 Dec 21, 2022
Python support for Godot 🐍🐍🐍

Godot Python, because you want Python on Godot ! The goal of this project is to provide Python language support as a scripting module for the Godot ga

Emmanuel Leblond 1.4k Jan 04, 2023
A visualization tool made in Pygame for various pathfinding algorithms.

Pathfinding-Visualizer 🚀 A visualization tool made in Pygame for various pathfinding algorithms. Pathfinding is closely related to the shortest path

Aysha sana 7 Jul 09, 2022
Geospatial Data Visualization using PyGMT

Example script to visualize topographic data, earthquake data, and tomographic data on a map

Utpal Kumar 2 Jul 30, 2022
Make sankey, alluvial and sankey bump plots in ggplot

The goal of ggsankey is to make beautiful sankey, alluvial and sankey bump plots in ggplot2

David Sjoberg 156 Jan 03, 2023
Collection of scripts for making high quality beautiful math-related posters.

Poster Collection of scripts for making high quality beautiful math-related posters. The poster can have as large printing size as 3x2 square feet wit

Nattawut Phetmak 3 Jun 09, 2022
Lime: Explaining the predictions of any machine learning classifier

lime This project is about explaining what machine learning classifiers (or models) are doing. At the moment, we support explaining individual predict

Marco Tulio Correia Ribeiro 10.3k Dec 29, 2022
Pebble is a stat's visualization tool, this will provide a skeleton to develop a monitoring tool.

Pebble is a stat's visualization tool, this will provide a skeleton to develop a monitoring tool.

Aravind Kumar G 2 Nov 17, 2021
ICS-Visualizer is an interactive Industrial Control Systems (ICS) network graph that contains up-to-date ICS metadata

ICS-Visualizer is an interactive Industrial Control Systems (ICS) network graph that contains up-to-date ICS metadata (Name, company, port, user manua

QeeqBox 2 Dec 13, 2021