Package managers visualization

Related tags

Data Visualizationpm
Overview

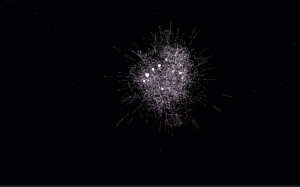
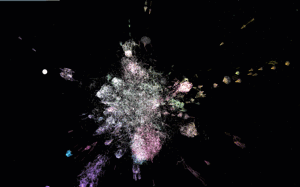
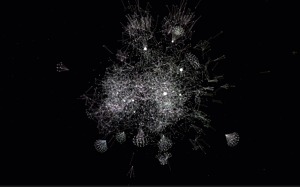
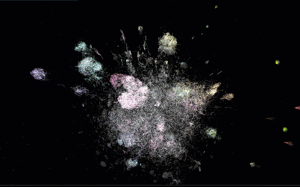
Software Galaxies

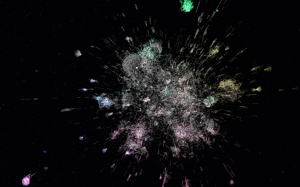
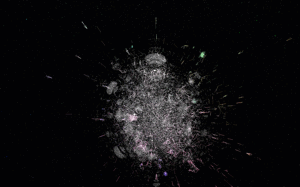
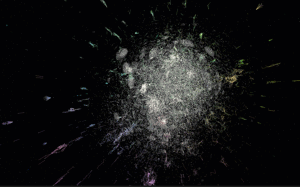
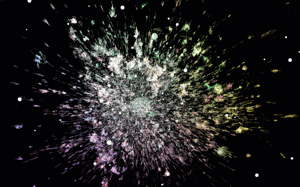
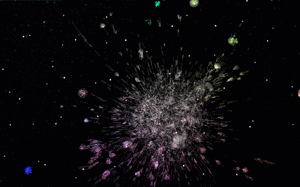
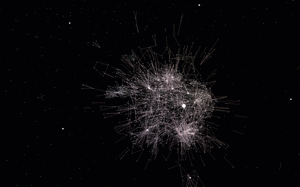
This repository combines visualizations of major software package managers.

All visualizations are available here: http://anvaka.github.io/pm/#/

Please read operating manual - it is short and describes basic navigation principles.

Repository was create for my talk at CascadiaJS 2015

After conference update - video - slides

Friends, you are awesome! I can't express how much I appreciate all your kind words and warm feedback. It really means a world for me. Thank you!

Individual Visualizations

Each graph is indexed individually, and data is pushed to gh-pages branch of galactic-data.

Bower
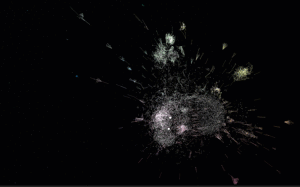

indexer | demo

PHP Composer


indexer | demo

Ruby gems


indexer | demo

npm


indexer | demo

Go


indexer | demo

R language


indexer | demo

Debian


indexer | demo

Arch Linux


indexer | demo

Arch Linux + AUR


indexer | demo

NuGet


indexer | demo

Homebrew


indexer | demo

PyPI


indexer | demo

Fedora


indexer | demo

Rust Crates


indexer | demo

Elm


indexer | demo

local development

git clone https://github.com/anvaka/pm
cd pm
npm i
npm start

This will start local development sever with auto-rebuild.

Your own graphs

This section has detailed instructions about how to use the tool with your own graphs. Before you read any further, if your graph is smaller than 10k nodes, consider using ngraph.pixel or VivaGraph both should be able to provide interactive layout.

If you have an interesting graph but don't have JavaScript experience, please feel free to reach out to me and I'll try to make visualization for you (my email is [email protected]).

Otherwise, if you want to hack on your own, please keep reading.

Graph

First, you will need a graph in ngraph.graph format. The ngraph.graph has detailed documentation about how to create graph, but it also has several loaders from popular graph formats (e.g. dot, gexf)

Layout

Now that you have a graph we need to compute the layout.

If your graph is smaller than 200k nodes, consider using ngraph.offline.layout. This module was created exactly for the purpose of the pm project, it is well documented, and should be easy to get started with. You can also read layout.js of all[gems|go|bower] packages to see more examples.

If your graph is much larger than 200k nodes, then consider using ngraph.native - this module is harder to work with (as it requires C++ knowledge), but it is much faster.

The secret GitHub visualization is using ngraph.native.

Data format

Once layout is computed, we are ready to visualize. Just save the graph using ngraph.tobinary and store it along with latest positions file (produced by layout) into a folder.

The folder structure should look like this:

.
└── my-pm-data-server
    └── my-graph
        ├── manifest.json
        └── version-1
            ├── labels.json         /* this file is produced by ngraph.tobinary */
            ├── links.bin           /* this file is produced by ngraph.tobinary */
            └── positions.bin       /* this file is produced by ngraph.native   */

The file manifest.json describes what version of the graph are available and has the following content:

{
  "all": ["version-1"],
  "last": "version-1"
}

Inside my-pm-data-server we launch a web server. I personally prefer http-server. Once it is installed globally (npm i http-server -g), you can launch it like this:

http-server --cors -p 9090

This will start a local data server at http://127.0.0.1:9090/

Update the config.js in this repository to point to your data server, and your graph should be accessible at

http://127.0.0.1:8081/#/galaxy/my-graph

Note

The galactic-data follows the same data structure as described above. Use it for the reference if you need an example

The secret visualization

The last shown visualization was secret GitHub followers visualization. It shows all GitHub users who has more than two followers.

The visualization has more than 1,100,000 nodes, and renders at 60 fps when flying around. The FPS drops when you hover-over nodes to 20-30, This is because we are doing hit-testing, to find what's under cursor.

With this many nodes, it runs well in the browser. Unfortunately it requires more than 1GB of RAM. Which may or may not crash your phone browser - sorry about this.

With all warnings said, here are the links:

Feedback

Please do not hesitate to provide your feedback or bug fixes. Even if it is something small like fixing a typo - I'd be glad to hear from you!

Owner
Andrei Kashcha
I love graphs
Andrei Kashcha
AB-test-analyzer - Python class to perform AB test analysis

AB-test-analyzer Python class to perform AB test analysis Overview This repo con

13 Jul 16, 2022
Create HTML profiling reports from pandas DataFrame objects

Pandas Profiling Documentation | Slack | Stack Overflow Generates profile reports from a pandas DataFrame. The pandas df.describe() function is great

10k Jan 01, 2023
metedraw is a project mainly for data visualization projects of Atmospheric Science, Marine Science, Environmental Science or other majors

It is mainly for data visualization projects of Atmospheric Science, Marine Science, Environmental Science or other majors.

Nephele 11 Jul 05, 2022
a plottling library for python, based on D3

Hello August 2013 Hello! Maybe you're looking for a nice Python interface to build interactive, javascript based plots that look as nice as all those

Mike Dewar 1.4k Dec 28, 2022
Streamlit dashboard examples - Twitter cashtags, StockTwits, WSB, Charts, SQL Pattern Scanner

streamlit-dashboards Streamlit dashboard examples - Twitter cashtags, StockTwits, WSB, Charts, SQL Pattern Scanner Tutorial Video https://ww

122 Dec 21, 2022
Visualize large time-series data in plotly

plotly_resampler enables visualizing large sequential data by adding resampling functionality to Plotly figures. In this Plotly-Resampler demo over 11

PreDiCT.IDLab 604 Dec 28, 2022
Python histogram library - histograms as updateable, fully semantic objects with visualization tools. [P]ython [HYST]ograms.

physt P(i/y)thon h(i/y)stograms. Inspired (and based on) numpy.histogram, but designed for humans(TM) on steroids(TM). The goal is to unify different

Jan Pipek 120 Dec 08, 2022
A small script written in Python3 that generates a visual representation of the Mandelbrot set.

Mandelbrot Set Generator A small script written in Python3 that generates a visual representation of the Mandelbrot set. Abstract The colors in the ou

1 Dec 28, 2021
🗾 Streamlit Component for rendering kepler.gl maps

streamlit-keplergl 🗾 Streamlit Component for rendering kepler.gl maps in a streamlit app. 🎈 Live Demo 🎈 Installation pip install streamlit-keplergl

Christoph Rieke 39 Dec 14, 2022
This is a small program that prints a user friendly, visual representation, of your current bsp tree

bspcq, q for query A bspc analyzer (utility for bspwm) This is a small program that prints a user friendly, visual representation, of your current bsp

nedia 9 Apr 24, 2022
A tool for creating Toontown-style nametags in Panda3D

Toontown-Nametag Toontown-Nametag is a tool for creating Toontown Online/Toontown Rewritten-style nametags in Panda3D. It contains a function, createN

BoggoTV 2 Dec 23, 2021
Attractors is a package for simulation and visualization of strange attractors.

attractors Attractors is a package for simulation and visualization of strange attractors. Installation The simplest way to install the module is via

Vignesh M 45 Jul 31, 2022
GD-UltraHack - A Mod Menu for Geometry Dash. Specifically a MegahackV5 clone in Python. Only for Windows

GD UltraHack: The Mod Menu that Nobody asked for. This is a mod menu for the gam

zeo 1 Jan 05, 2022
Plot-configurations for scientific publications, purely based on matplotlib

TUEplots Plot-configurations for scientific publications, purely based on matplotlib. Usage Please have a look at the examples in the example/ directo

Nicholas Krämer 487 Jan 08, 2023
View part of your screen in grayscale or simulated color vision deficiency.

monolens View part of your screen in grayscale or filtered to simulate color vision deficiency. Watch the demo on YouTube. Install with pip install mo

Hans Dembinski 31 Oct 11, 2022
Jupyter Notebook extension leveraging pandas DataFrames by integrating DataTables and ChartJS.

Jupyter DataTables Jupyter Notebook extension to leverage pandas DataFrames by integrating DataTables JS. About Data scientists and in fact many devel

Marek Čermák 142 Dec 28, 2022
📊📈 Serves up Pandas dataframes via the Django REST Framework for use in client-side (i.e. d3.js) visualizations and offline analysis (e.g. Excel)

📊📈 Serves up Pandas dataframes via the Django REST Framework for use in client-side (i.e. d3.js) visualizations and offline analysis (e.g. Excel)

wq framework 1.2k Jan 01, 2023
Time series visualizer is a flexible extension that provides filling world map by country from real data.

Time-series-visualizer Time series visualizer is a flexible extension that provides filling world map by country from csv or json file. You can know d

Long Ng 3 Jul 09, 2021
D-Analyst : High Performance Visualization Tool

D-Analyst : High Performance Visualization Tool D-Analyst is a high performance data visualization built with python and based on OpenGL. It allows to

4 Apr 14, 2022
Area-weighted venn-diagrams for Python/matplotlib

Venn diagram plotting routines for Python/Matplotlib Routines for plotting area-weighted two- and three-circle venn diagrams. Installation The simples

Konstantin Tretyakov 400 Dec 31, 2022