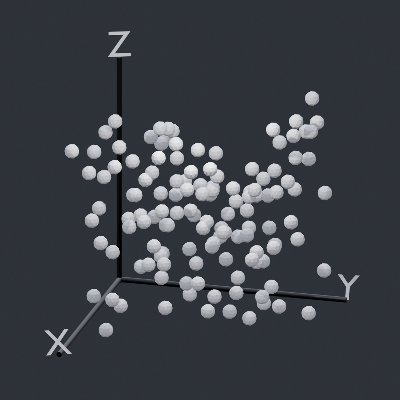
Data-FX is an addon for Blender (2.9) that allows for the visualization of data with different charts

Overview

Data-FX

Data-FX is an addon for Blender (2.9) that allows for the visualization of data with different charts

Currently, there are only 2 chart options...

  • A Scatter plot which plots up to 3 values in 3d space
  • And a "Map plot" that visualizes points on a sphere when given longitudes and latitudes

Below are some examples

How To

Data-FX is located in the View3D sidebar (N -> DataFX)

Simply select the headers from your csv file, edit your settings, and hit generate!

Notable Features

  • Custom duplicate objects (Scatter Plot)
  • Auto axis markers (Scatter Plot)
  • Auto populating .csv header selection (Scatter Plot, Map Plot)
  • Support of Geographic coordinate data (Map Plot)

Planned Features

  • More chart types
  • More supported data types
  • Various chart loading optimizations
  • Global chart menu
You might also like...
Streamlit dashboard examples - Twitter cashtags, StockTwits, WSB, Charts, SQL Pattern Scanner

streamlit-dashboards Streamlit dashboard examples - Twitter cashtags, StockTwits, WSB, Charts, SQL Pattern Scanner Tutorial Video https://ww

mysql relation charts

sqlcharts 自动生成数据库关联关系图 复制settings.py.example 重命名为settings.py 将数据库配置信息填入settings.DATABASE,目前支持mysql和postgresql 执行 python build.py -b,-b是读取数据库表结构,如果只更新匹

Altair extension for saving charts in a variety of formats.

Altair Saver This packge provides extensions to Altair for saving charts to a variety of output types. Supported output formats are: .json/.vl.json: V

🐞 📊 Ladybug extension to generate 2D charts

ladybug-charts Ladybug extension to generate 2D charts. Installation pip install ladybug-charts QuickStart import ladybug_charts API Documentation Loc

GitHub English Top Charts

Help you discover excellent English projects and get rid of the interference of other spoken language.

Simple addon for snapping active object to mesh ground

Snap to Ground Simple addon for snapping active object to mesh ground How to install: install the Python file as an addon use shortcut "D" in 3D view

Apache Superset is a Data Visualization and Data Exploration Platform

Superset A modern, enterprise-ready business intelligence web application. Why Superset? | Supported Databases | Installation and Configuration | Rele

Apache Superset is a Data Visualization and Data Exploration Platform

Apache Superset is a Data Visualization and Data Exploration Platform

Automatic data visualization in atom with the nteract data-explorer

Data Explorer Interactively explore your data directly in atom with hydrogen! The nteract data-explorer provides automatic data visualization, so you

Comments
  • Map Values in Scatter Plot

    Map Values in Scatter Plot

    Currently all values are read from the file and directly translated into their respective positions. Instead of this being hard-coded, the user should be able to choose the size of the graph they want and have the values be mapped to that range.

    enhancement 
    opened by LandonFerg 2
  • Allow Headers in CSV to be Viewed in Plugin

    Allow Headers in CSV to be Viewed in Plugin

    Right now Data-FX only uses numerics to represent the headers you want to select for your x, y and z values for generating a scatter plot. These should be represented instead by their header names to be more human readable.

    opened by LandonFerg 1
Owner
Landon Ferguson
Hello World
Landon Ferguson
Handout for the tutorial "Creating publication-quality figures with matplotlib"

Handout for the tutorial "Creating publication-quality figures with matplotlib"

JB Mouret 1.9k Jan 02, 2023
OpenStats is a library built on top of streamlit that extracts data from the Github API and shows the main KPIs

Open Stats Discover and share the KPIs of your OpenSource project. OpenStats is a library built on top of streamlit that extracts data from the Github

Pere Miquel Brull 4 Apr 03, 2022
A programming language built on top of Python to easily allow Swahili speakers to get started with programming without ever knowing English

pyswahili A programming language built over Python to easily allow swahili speakers to get started with programming without ever knowing english pyswa

Jordan Kalebu 72 Dec 15, 2022
Render Jupyter notebook in the terminal

jut - JUpyter notebook Terminal viewer. The command line tool view the IPython/Jupyter notebook in the terminal. Install pip install jut Usage $jut --

Kracekumar 169 Dec 27, 2022
Open-questions - Open questions for Bellingcat technical contributors

Open questions for Bellingcat technical contributors These are difficult, long-term projects that would contribute to open source investigations at Be

Bellingcat 234 Dec 31, 2022
A Python library for plotting hockey rinks with Matplotlib.

Hockey Rink A Python library for plotting hockey rinks with Matplotlib. Installation pip install hockey_rink Current Rinks The following shows the cus

24 Jan 02, 2023
Matplotlib colormaps from the yt project !

cmyt Matplotlib colormaps from the yt project ! Colormaps overview The following colormaps, as well as their respective reversed (*_r) versions are av

The yt project 5 Sep 16, 2022
UNMAINTAINED! Renders beautiful SVG maps in Python.

Kartograph is not maintained anymore As you probably already guessed from the commit history in this repo, Kartograph.py is not maintained, which mean

1k Dec 09, 2022
Graphical visualizer for spectralyze by Lauchmelder23

spectralyze visualizer Graphical visualizer for spectralyze by Lauchmelder23 Install Install matplotlib and ffmpeg. Put ffmpeg.exe in same folder as v

Matthew 1 Dec 21, 2021
Pyan3 - Offline call graph generator for Python 3

Pyan takes one or more Python source files, performs a (rather superficial) static analysis, and constructs a directed graph of the objects in the combined source, and how they define or use each oth

Juha Jeronen 235 Jan 02, 2023
A simple interpreted language for creating basic mathematical graphs.

graphr Introduction graphr is a small language written to create basic mathematical graphs. It is an interpreted language written in python and essent

2 Dec 26, 2021
A simple code for plotting figure, colorbar, and cropping with python

Python Plotting Tools This repository provides a python code to generate figures (e.g., curves and barcharts) that can be used in the paper to show th

Guanying Chen 134 Jan 02, 2023
CompleX Group Interactions (XGI) provides an ecosystem for the analysis and representation of complex systems with group interactions.

XGI CompleX Group Interactions (XGI) is a Python package for the representation, manipulation, and study of the structure, dynamics, and functions of

Complex Group Interactions 67 Dec 28, 2022
基于python爬虫爬取COVID-19爆发开始至今全球疫情数据并利用Echarts对数据进行分析与多样化展示。

COVID-19-Epidemic-Map 基于python爬虫爬取COVID-19爆发开始至今全球疫情数据并利用Echarts对数据进行分析与多样化展示。 觉得项目还不错的话欢迎给一个star! 项目的源码可以正常运行,各个库的版本、数据库的建表语句、运行过程中遇到的坑以及解决方式在笔记.md中都

31 Dec 15, 2022
🐞 📊 Ladybug extension to generate 2D charts

ladybug-charts Ladybug extension to generate 2D charts. Installation pip install ladybug-charts QuickStart import ladybug_charts API Documentation Loc

Ladybug Tools 3 Dec 30, 2022
D-Analyst : High Performance Visualization Tool

D-Analyst : High Performance Visualization Tool D-Analyst is a high performance data visualization built with python and based on OpenGL. It allows to

4 Apr 14, 2022
China and India Population and GDP Visualization

China and India Population and GDP Visualization Historical Population Comparison between India and China This graph shows the population data of Indi

Nicolas De Mello 10 Oct 27, 2021
Displaying plot of death rates from past years in Poland. Data source from these years is in readme

Average-Death-Rate Displaying plot of death rates from past years in Poland The goal collect the data from a CSV file count the ADR (Average Death Rat

Oliwier Szymański 0 Sep 12, 2021
A simple Monte Carlo simulation using Python and matplotlib library

Monte Carlo python simulation Install linux dependencies sudo apt update sudo apt install build-essential \ software-properties-commo

Samuel Terra 2 Dec 13, 2021
https://there.oughta.be/a/macro-keyboard

inkkeys Details and instructions can be found on https://there.oughta.be/a/macro-keyboard In contrast to most of my other projects, I decided to put t

Sebastian Staacks 209 Dec 21, 2022