A tool for automatically generating 3D printable STLs from freely available lidar scan data.

Overview

mini-map-maker

A tool for automatically generating 3D printable STLs from freely available lidar scan data.

Screenshots

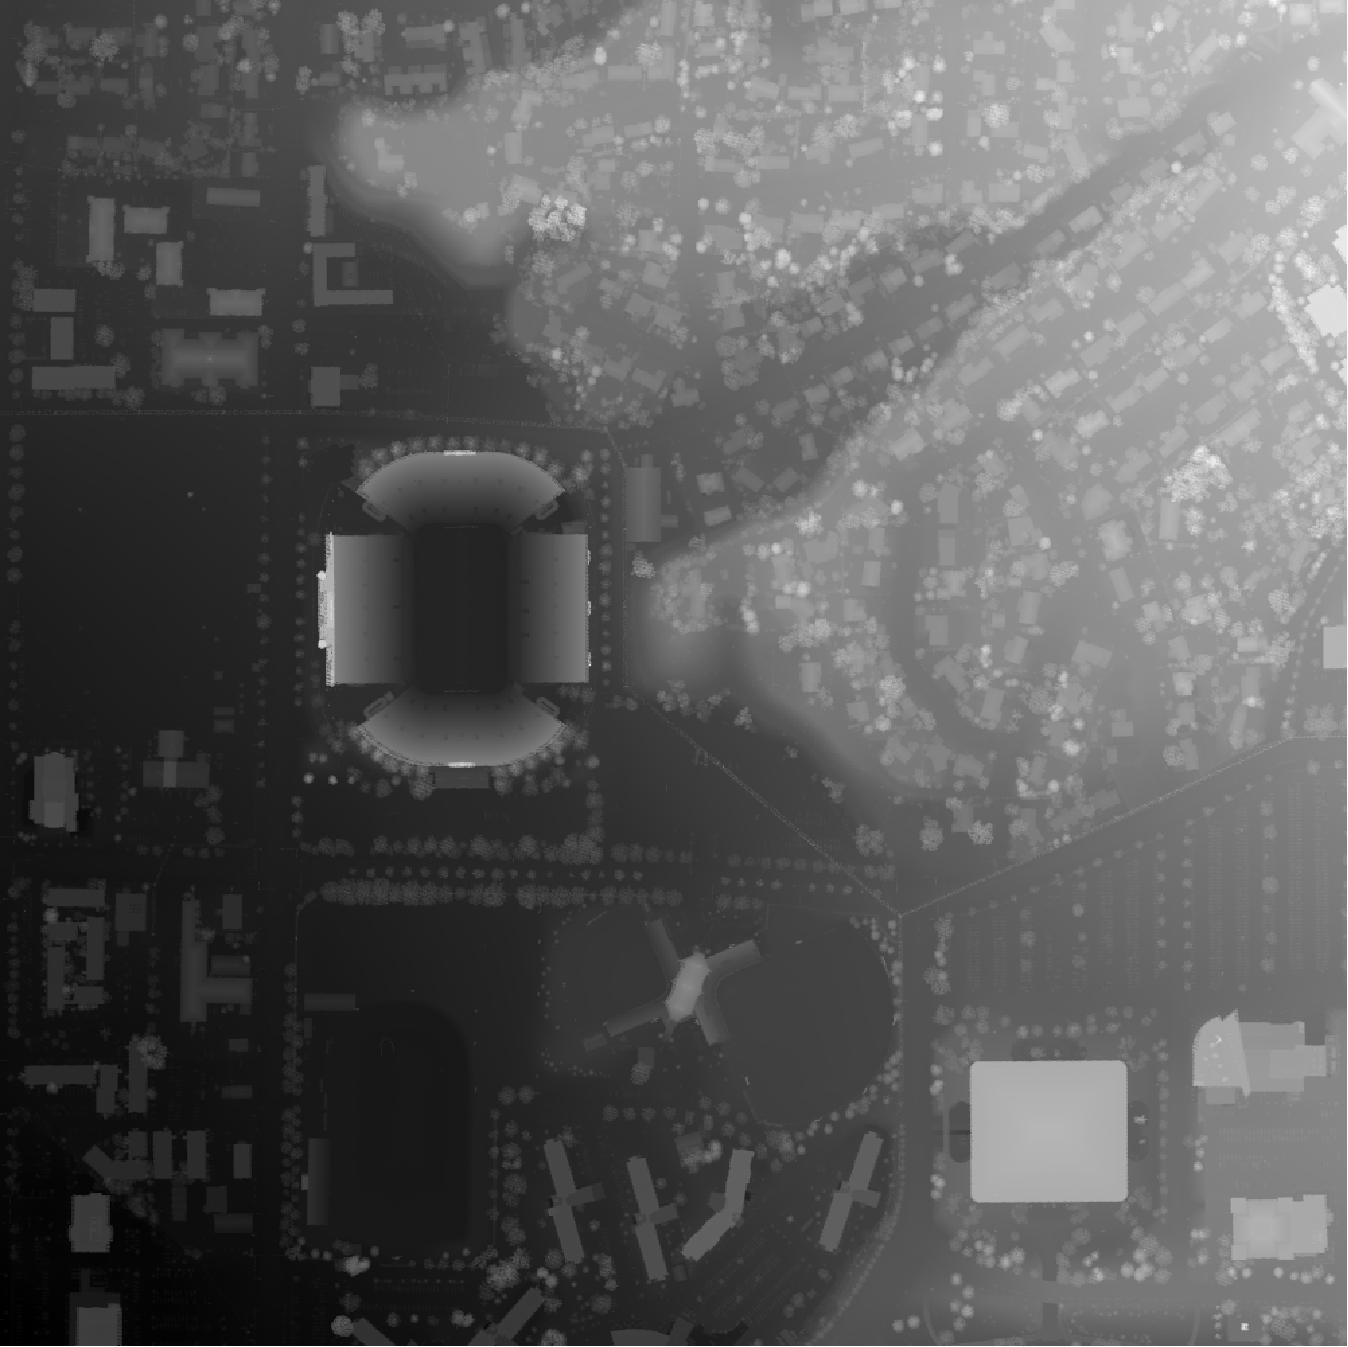
image image

Tutorial

To use this script, go to the USGS LidarExplorer

https://prd-tnm.s3.amazonaws.com/LidarExplorer/index.html#/

Select an area, and then click the "Download list" button under "Lidar within AOI" image This should give you a file called downloadlist.txt. Simply place this text file in the same directory as the script, and then run the script (convert.py, or convert.exe if you don't want to deal with Python). By default, mini-map-maker will generate an STL file for each tile in the lidar data. However, there are quite a few command line arguments that you can use to customize the output.

>convert.py -h

usage: convert [-h] [--input INPUT] [--reduce REDUCE] [--vscale VSCALE]
               [--base BASE] [--merge] [--no_stl] [--cleanup] [--filter FILTER] [--prj]

A utility for automatically generating 3D printable STLs from USGS lidar scans.

optional arguments:
  -h, --help            show this help message and exit
  
  --input INPUT, -i INPUT
                        The name of the file containing the URLs of all of the lidar scan data.
                        
  --reduce REDUCE, -r REDUCE
                        A decimal value that will decrease the output file size as it increases.
                        The default value is 1.0
                        
  --vscale VSCALE, -v VSCALE
                        A decimal value that will make artificially make things taller as it increases.
                        The default value is 1.0
                        
  --base BASE, -b BASE  A decimal value that sets the base height of the model. The default value is 0.0
  
  --merge, -m           Using this flag will merge all of the point clouds into one file before converting into a DEM.
  
  --no_stl, -s          Using this flag will disable STL generation.
  
  --cleanup, -c         Using this flag will cause the program to automatically delete the unzipped point cloud files
                        after running.
                        
  --filter FILTER, -f FILTER
                        A percent value (0-100, for the slope of the points being smoothed) that will enable the spike
                        smoothing option. This is good if you have points that are floating way up above the model and
                        causing spikes in your final model.
                        
  --prj, -p             Using this flag will cause the program to automatically download and use lastools to generate
                        projection files for the elevation models. This is important if you want to generate the STLs
                        yourself in QGIS, but it means you'll have to be mindful of lastool's license limitations.
                        More info on lastool's website (https://rapidlasso.com/lastools/).
                        
  --external_files, -e  Using this flag will grab las/laz files from the LAS directory instead of downloading them from
                        an input list.

Additional Examples:

External Files

Let's say you already have some las files you want to use. Simply place them into a directory called LAS, and then call the script from from the directory containing the LAS folder, using the --external_files flag, like so:

convert.py --external_files

This trick also works with LAZ files, or even a mix of LAZ and LAS files.

Adding a Base and Manipulating the Output

For one project, I had a LAZ file that had a section of ocean. This caused the output to be super flat, and too thin in several places to print well. Additionally, it was a pretty high resolution file, so the output STL was very large, and I wasn't happy with the vertical scale of the file either. So, after placing my LAZ file into a directory labeled LAS like mentioned above, I used the following command:

convert.py --external_files --filter 50 --base 10 --vscale 0.5 --reduce 2

Filtering got rid of some weird spikes in the output STL, and the base command increased the total height of the output. The vscale command made the model shorter, and reduce significantly decreased the size of the STL.

Support This Project

Like this project? Feel free to make a donation.

ko-fi

Licensing

With the default options, this program is completely open source, and the output is usable in a commercial environment. This code itself is MIT License, as is r-barnes' DEMto3D library that this program makes use of.

https://github.com/r-barnes/DEMto3D

If you want to use the output in QGIS or another GIS program, and enable .prj file generation, then the sript will automatically download lastools. The .prj files generated are free to use if it's not for commercial purposes. If you plan on using the .prj files for commercial purposes, you will need to purchase a lastools license in accordance with the information on lastool's website:

https://rapidlasso.com/lastools/

Additionally, this script makes use of some public domain utilities from FUSION by the US Forest Service

http://forsys.sefs.uw.edu/FUSION/fusion_overview.html

With the addition of LAZ processing, this project now utilizes LASzip, an LGPL-2.1 tool. It is included as a precompiled binary (laszip-cli.exe), and no modifications have been made.
https://github.com/LASzip/LASzip

Owner
Mike Abbott
Mike Abbott
Implement the Perspective open source code in preparation for data visualization

Task Overview | Installation Instructions | Link to Module 2 Introduction Experience Technology at JP Morgan Chase Try out what real work is like in t

Abdulazeez Jimoh 1 Jan 23, 2022
Automatically Visualize any dataset, any size with a single line of code. Created by Ram Seshadri. Collaborators Welcome. Permission Granted upon Request.

AutoViz Automatically Visualize any dataset, any size with a single line of code. AutoViz performs automatic visualization of any dataset with one lin

AutoViz and Auto_ViML 1k Jan 02, 2023
SummVis is an interactive visualization tool for text summarization.

SummVis is an interactive visualization tool for analyzing abstractive summarization model outputs and datasets.

Robustness Gym 246 Dec 08, 2022
University of Missouri - Kansas City: CS451R: Capstone

CS451RC University of Missouri - Kansas City: CS451R: Capstone Installation cd git clone https://github.com/ala2q6/CS451RC.git cd CS451RC pip3 instal

Alex Arbuckle 1 Nov 17, 2021
Simple addon for snapping active object to mesh ground

Snap to Ground Simple addon for snapping active object to mesh ground How to install: install the Python file as an addon use shortcut "D" in 3D view

Iyad Ahmed 12 Nov 07, 2022
JSNAPY example: Validate NAT policies

JSNAPY example: Validate NAT policies Overview This example will show how to use JSNAPy to make sure the expected NAT policy matches are taking place.

Calvin Remsburg 1 Jan 07, 2022
:small_red_triangle: Ternary plotting library for python with matplotlib

python-ternary This is a plotting library for use with matplotlib to make ternary plots plots in the two dimensional simplex projected onto a two dime

Marc 611 Dec 29, 2022
cqMore is a CadQuery plugin based on CadQuery 2.1.

cqMore (under construction) cqMore is a CadQuery plugin based on CadQuery 2.1. Installation Please use conda to install CadQuery and its dependencies

Justin Lin 36 Dec 21, 2022
EPViz is a tool to aid researchers in developing, validating, and reporting their predictive modeling outputs.

EPViz (EEG Prediction Visualizer) EPViz is a tool to aid researchers in developing, validating, and reporting their predictive modeling outputs. A lig

Jeff 2 Oct 19, 2022
Bioinformatics tool for exploring RNA-Protein interactions

Explore RNA-Protein interactions. RNPFind is a bioinformatics tool. It takes an RNA transcript as input and gives a list of RNA binding protein (RBP)

Nahin Khan 3 Jan 27, 2022
Python script to generate a visualization of various sorting algorithms, image or video.

sorting_algo_visualizer Python script to generate a visualization of various sorting algorithms, image or video.

146 Nov 12, 2022
Visualizations of some specific solutions of different differential equations.

Diff_sims Visualizations of some specific solutions of different differential equations. Heat Equation in 1 Dimension (A very beautiful and elegant ex

2 Jan 13, 2022
Create animated and pretty Pandas Dataframe or Pandas Series

Rich DataFrame Create animated and pretty Pandas Dataframe or Pandas Series, as shown below: Installation pip install rich-dataframe Usage Minimal exa

Khuyen Tran 92 Dec 26, 2022
Define fortify and autoplot functions to allow ggplot2 to handle some popular R packages.

ggfortify This package offers fortify and autoplot functions to allow automatic ggplot2 to visualize statistical result of popular R packages. Check o

Sinhrks 504 Dec 23, 2022
Voilà, install macOS on ANY Computer! This is really and magic easiest way!

OSX-PROXMOX - Run macOS on ANY Computer - AMD & Intel Install Proxmox VE v7.02 - Next, Next & Finish (NNF). Open Proxmox Web Console - Datacenter N

Gabriel Luchina 654 Jan 09, 2023
HW 2: Visualizing interesting datasets

HW 2: Visualizing interesting datasets Check out the project instructions here! Mean Earnings per Hour for Males and Females My first graph uses data

7 Oct 27, 2021
Chem: collection of mostly python code for molecular visualization, QM/MM, FEP, etc

chem: collection of mostly python code for molecular visualization, QM/MM, FEP,

5 Sep 02, 2022
Compute and visualise incidence (reworking of the original incidence package)

incidence2 incidence2 is an R package that implements functions and classes to compute, handle and visualise incidence from linelist data. It refocuss

15 Nov 22, 2022
Browse Dash docsets inside emacs

Helm Dash What's it This package uses Dash docsets inside emacs to browse documentation. Here's an article explaining the basic usage of it. It doesn'

504 Dec 15, 2022
🎨 Python3 binding for `@AntV/G2Plot` Plotting Library .

PyG2Plot 🎨 Python3 binding for @AntV/G2Plot which an interactive and responsive charting library. Based on the grammar of graphics, you can easily ma

hustcc 990 Jan 05, 2023