Resources for teaching & learning practical data visualization with python.

Overview

Practical Data Visualization with Python

Overview

All views expressed on this site are my own and do not represent the opinions of any entity with which I have been, am now, or will be affiliated.

This repository contains all materials related to a lecture / seminar I teach on practical data visualization with python. What I mean by "practical" is that the materials herein do not focus on one particular library or data visualization method; rather, my goal is to empower the consumer of this content with the tools, heuristics, and methods needed to handle a wide variety of data visualization problems.

If you have questions, comments, or suggested alterations to these materials, please open an issue here on GitHub. Also, don't hesitate to reach out via LinkedIn.

Outline of Materials

Below you'll find a brief outline of the content contained in the four sections of this seminar, along with notebook links, and an example visualization from each section. For each section there is a separate notebook of python code containing all the materials for that section. Each notebook will start with a few setup steps--package imports and data prep mostly--that are almost identical between the notebooks, directly after which comes the content for each section. For information about the data used in these materials, check out the data_prep_nb.ipynb notebook, the easy-to-view version of which is hosted here.

Section 1: Why We Visualize

Here is the link to the easy-to-view notebook for this section of material.
Here is the link to the GitHub-hosted notebook for this section of the material.

  1. The power of visual data representation and storytelling.
  2. A few principles and heuristics of visualization.
  3. The building blocks of visualization explored.

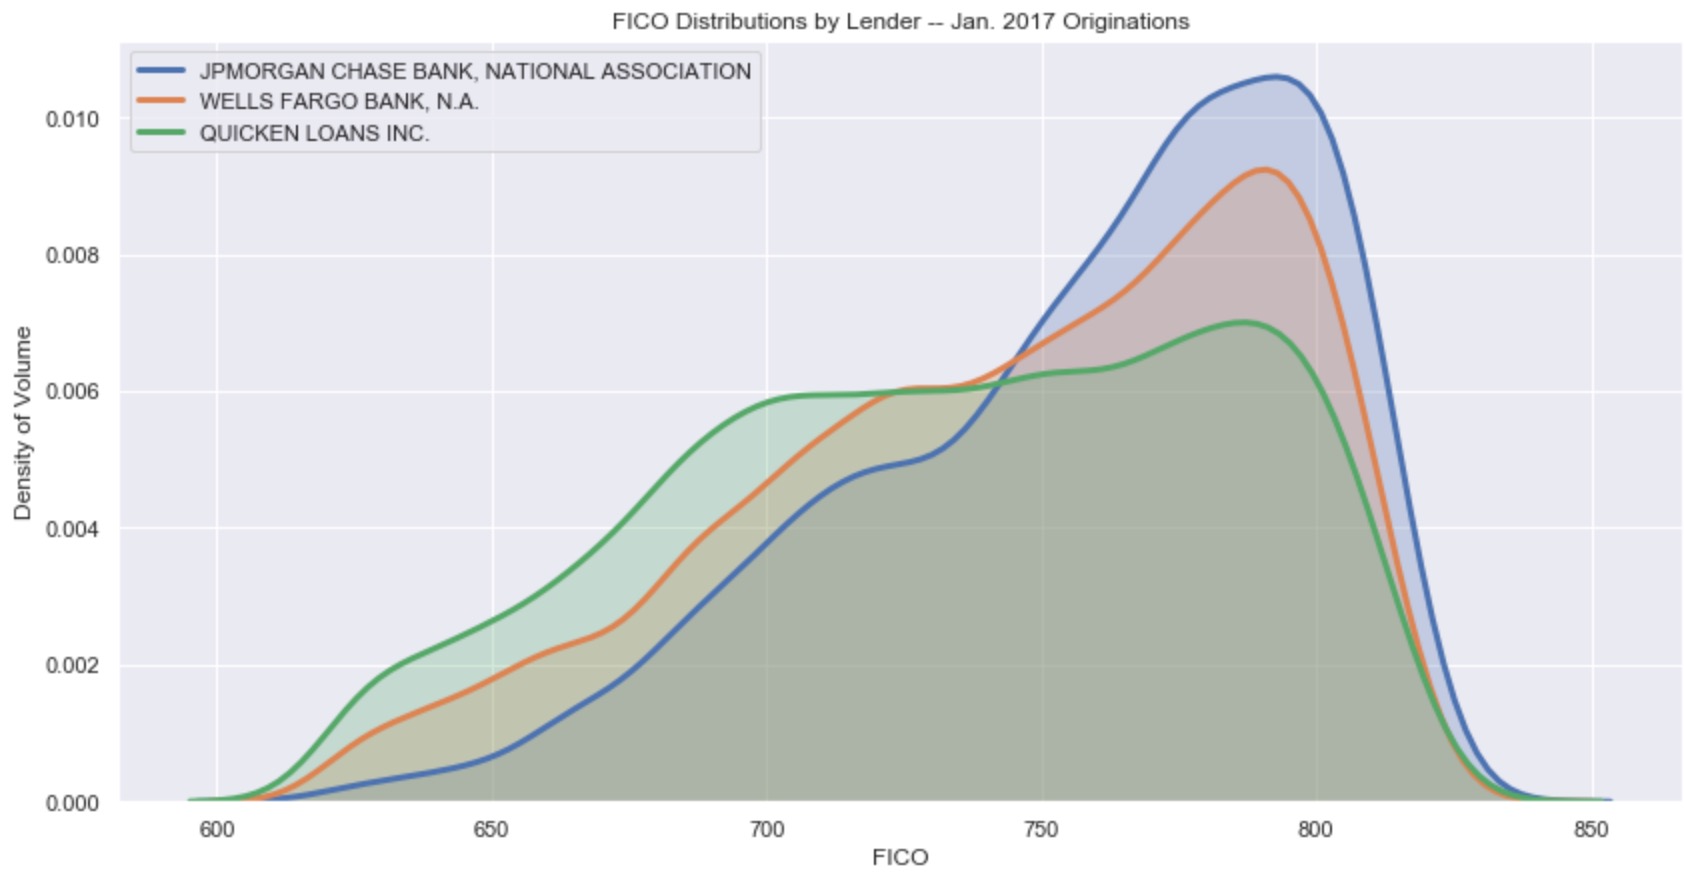
Example Visualization from this Section:

Section 2: Overview of Python Visualization Landscape

Here is the link to the easy-to-view notebook for this section of material.
Here is the link to the GitHub-hosted notebook for this section of the material.

  1. Intro to the visualization ecosystem: python's Tower of Babel.
  2. Smorgasbord of packages explored through a single example viz.
  3. Quick & dirty (and subjective) heuristics for picking a visualization package.

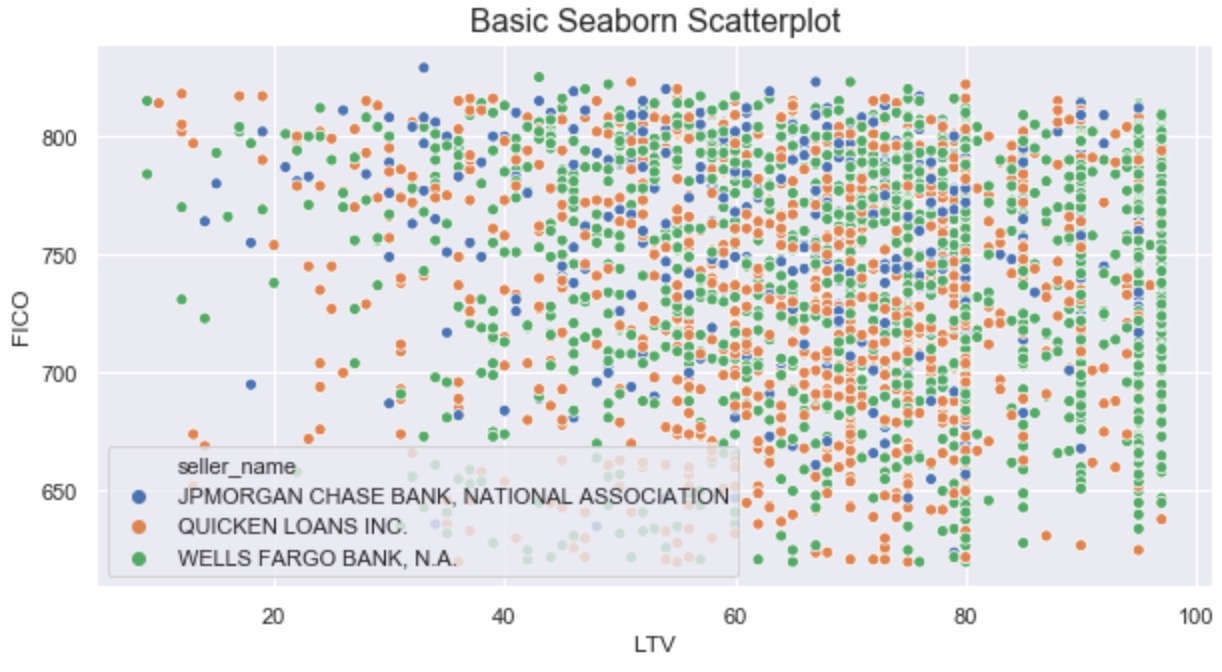
Example Visualization from this Section:

Section 3: Statistical Visualization in the Wild

Here is the link to the easy-to-view notebook for this section of material.
Here is the link to the GitHub-hosted notebook for this section of the material.

  1. Example business use case of data visualization:
    1. Observational:
      • mean, median, and variance
      • distributions
    2. Inferential:
      • parametric tests
      • non-parametric tests

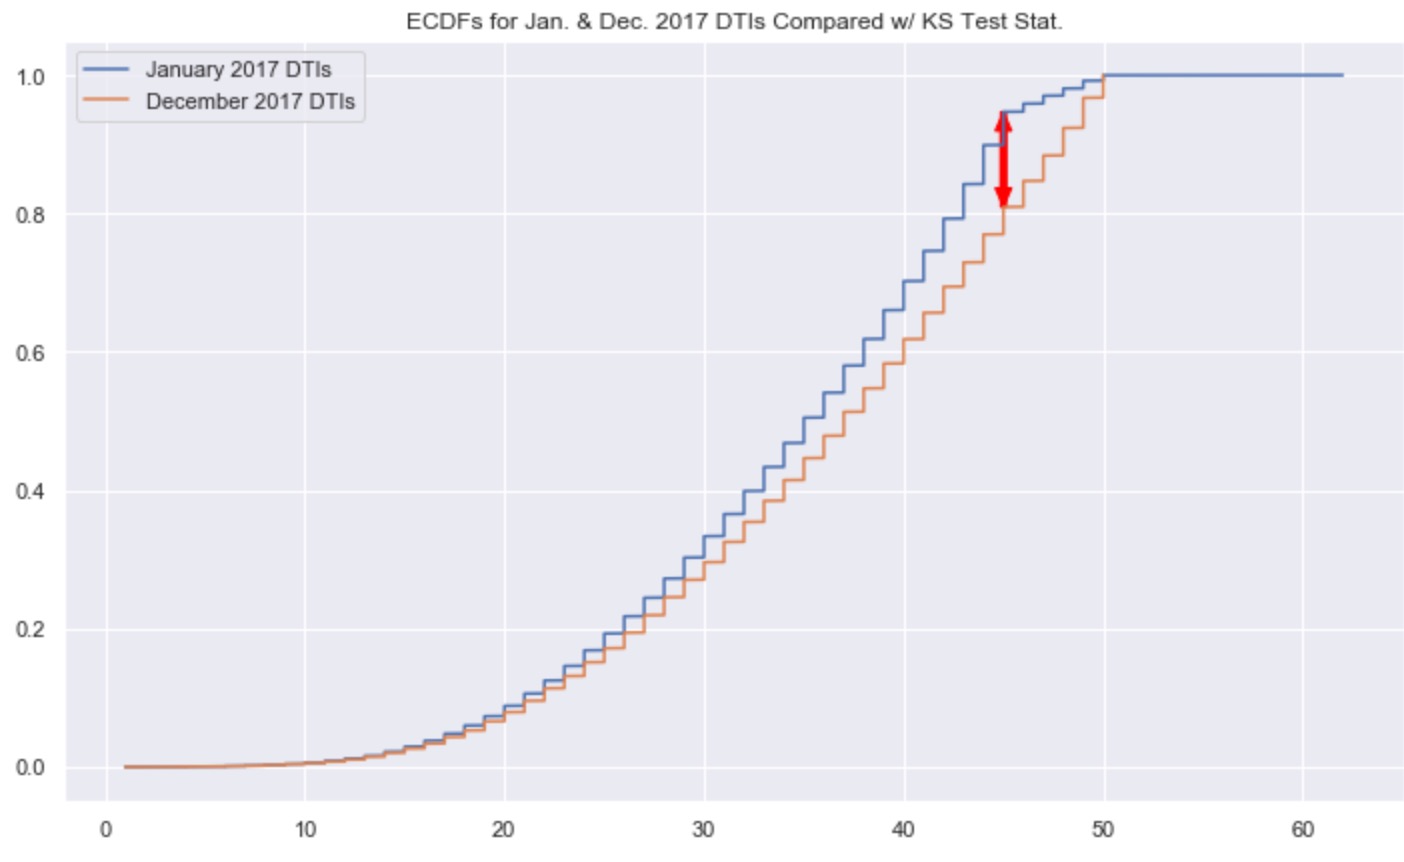
Example Visualization from this Section:

Section 4: Library Deep-Dive (Plotly)

Here is the link to the easy-to-view notebook for this section of material.
Here is the link to the GitHub-hosted notebook for this section of the material.

  1. Quick and simple data visualizations with Plotly Express.
  2. Additional control and complexity with base Plotly.

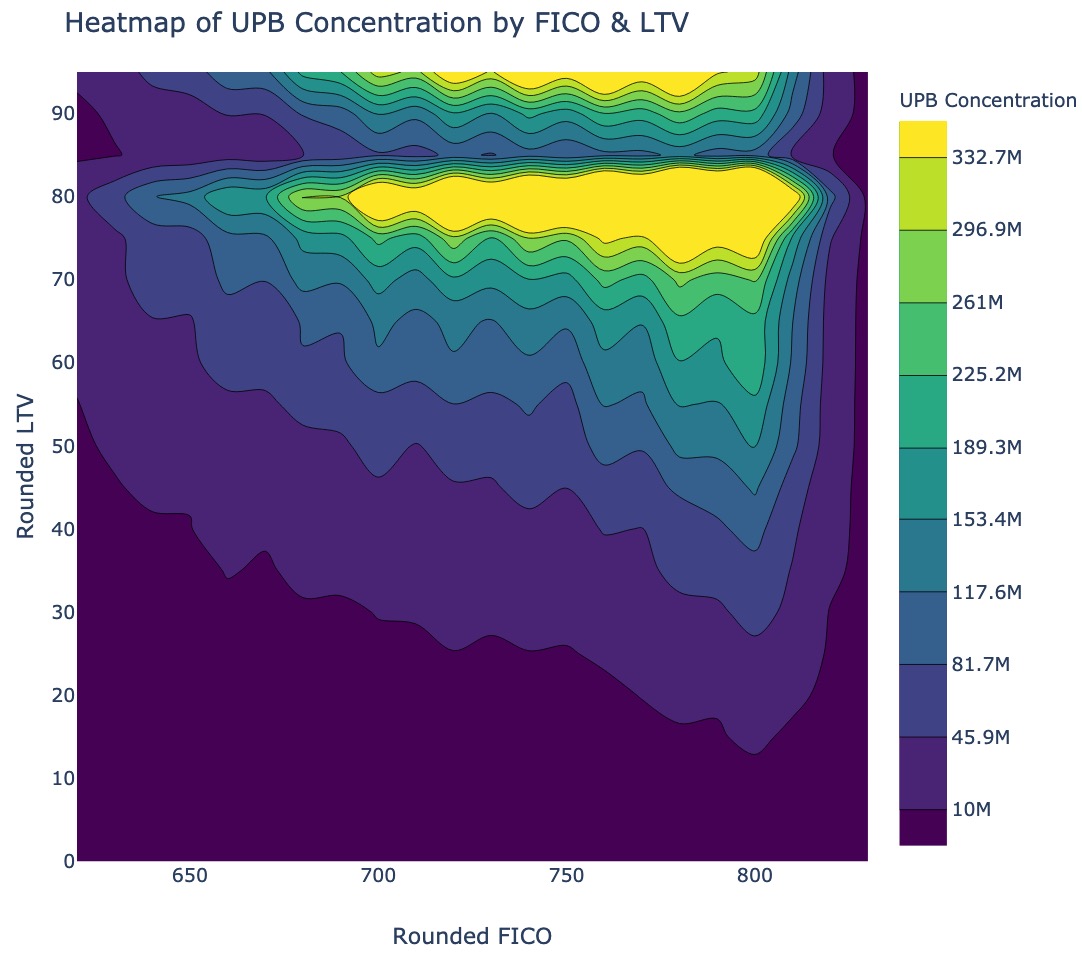
Example Visualization from this Section:

Homework Exercises

There is a homework associated with these materials, for those interested. Given the open-ended nature of the homework, there is no answer key. That said, if you're working through it and would like some feedback, feel free to reach out to me via LinkedIn.

Here is the link to the easy-to-view homework notebook.
Here is the link to the GitHub-hosted version of the homework notebook.

Setup Instructions

  • clone this repository
  • create a virtual environment using python3 -m venv env
  • activate that virtual environment using source env/bin/activate
  • install needed packages using pip install -r requirements.txt
  • run an instance of jupyter lab out of your virutal env using env/bin/jupyter-lab
  • open and run the four main files of content for this course--one for each section:
    • part_1_main_nb.ipynb
    • part_2_main_nb.ipynb
    • part_3_main_nb.ipynb
    • part_4_main_nb.ipynb
Owner
Paul Jeffries
Trained in intl. econ; started in mortgage finance; dabbled in equities & crypto; now working in banking. I enjoy challenging questions regarding value & risk.
Paul Jeffries
Practical-statistics-for-data-scientists - Code repository for O'Reilly book

Code repository Practical Statistics for Data Scientists: 50+ Essential Concepts Using R and Python by Peter Bruce, Andrew Bruce, and Peter Gedeck Pub

1.7k Jan 04, 2023
Political elections, appointment, analysis and visualization in Python

Political elections, appointment, analysis and visualization in Python poli-sci-kit is a Python package for political science appointment and election

Andrew Tavis McAllister 9 Dec 01, 2022
Glue is a python project to link visualizations of scientific datasets across many files.

Glue Glue is a python project to link visualizations of scientific datasets across many files. Click on the image for a quick demo: Features Interacti

675 Dec 09, 2022
Typical: Fast, simple, & correct data-validation using Python 3 typing.

typical: Python's Typing Toolkit Introduction Typical is a library devoted to runtime analysis, inference, validation, and enforcement of Python types

Sean 171 Jan 02, 2023
An intuitive library to add plotting functionality to scikit-learn objects.

Welcome to Scikit-plot Single line functions for detailed visualizations The quickest and easiest way to go from analysis... ...to this. Scikit-plot i

Reiichiro Nakano 2.3k Dec 31, 2022
plotly scatterplots which show molecule images on hover!

molplotly Plotly scatterplots which show molecule images on hovering over the datapoints! Required packages: pandas rdkit jupyter_dash ➡️ See example.

150 Dec 28, 2022
Design your own matplotlib stylefile interactively

Tired of playing with font sizes and other matplotlib parameters every time you start a new project or write a new plotting function? Want all you plots have the same style? Use matplotlib configurat

yobi byte 207 Dec 08, 2022
A Jupyter - Three.js bridge

pythreejs A Python / ThreeJS bridge utilizing the Jupyter widget infrastructure. Getting Started Installation Using pip: pip install pythreejs And the

Jupyter Widgets 844 Dec 27, 2022
Create charts with Python in a very similar way to creating charts using Chart.js

Create charts with Python in a very similar way to creating charts using Chart.js. The charts created are fully configurable, interactive and modular and are displayed directly in the output of the t

Nicolas H 68 Dec 08, 2022
A high-level plotting API for pandas, dask, xarray, and networkx built on HoloViews

hvPlot A high-level plotting API for the PyData ecosystem built on HoloViews. Build Status Coverage Latest dev release Latest release Docs What is it?

HoloViz 694 Jan 04, 2023
mysql relation charts

sqlcharts 自动生成数据库关联关系图 复制settings.py.example 重命名为settings.py 将数据库配置信息填入settings.DATABASE,目前支持mysql和postgresql 执行 python build.py -b,-b是读取数据库表结构,如果只更新匹

6 Aug 22, 2022
Flow-based visual scripting for Python

A simple visual node editor for Python Ryven combines flow-based visual scripting with Python. It gives you absolute freedom for your nodes and a simp

Leon Thomm 3.1k Jan 06, 2023
Debugging, monitoring and visualization for Python Machine Learning and Data Science

Welcome to TensorWatch TensorWatch is a debugging and visualization tool designed for data science, deep learning and reinforcement learning from Micr

Microsoft 3.3k Dec 27, 2022
Interactive chemical viewer for 2D structures of small molecules

👀 mols2grid mols2grid is an interactive chemical viewer for 2D structures of small molecules, based on RDKit. ➡️ Try the demo notebook on Google Cola

Cédric Bouysset 154 Dec 26, 2022
YOPO is an interactive dashboard which generates various standard plots.

YOPO is an interactive dashboard which generates various standard plots.you can create various graphs and charts with a click of a button. This tool uses Dash and Flask in backend.

ADARSH C 38 Dec 20, 2022
A simple interpreted language for creating basic mathematical graphs.

graphr Introduction graphr is a small language written to create basic mathematical graphs. It is an interpreted language written in python and essent

2 Dec 26, 2021
With Holoviews, your data visualizes itself.

HoloViews Stop plotting your data - annotate your data and let it visualize itself. HoloViews is an open-source Python library designed to make data a

HoloViz 2.3k Jan 04, 2023
paintable GitHub contribute table

githeart paintable github contribute table how to use: Functions key color select 1,2,3,4,5 clear c drawing mode mode on turn off e print paint matrix

Bahadır Araz 27 Nov 24, 2022
Analysis and plotting for motor/prop/ESC characterization, thrust vs RPM and torque vs thrust

esc_test This is a Python package used to plot and analyze data collected for the purpose of characterizing a particular propeller, motor, and ESC con

Alex Spitzer 1 Dec 28, 2021
A Python-based non-fungible token (NFT) generator built using Samilla and Matplotlib

PyNFT A Pythonic NF (non-fungible token) generator built using Samilla and Matplotlib Use python pynft.py [amount] The intention behind this generato

Ayush Gundawar 6 Feb 07, 2022