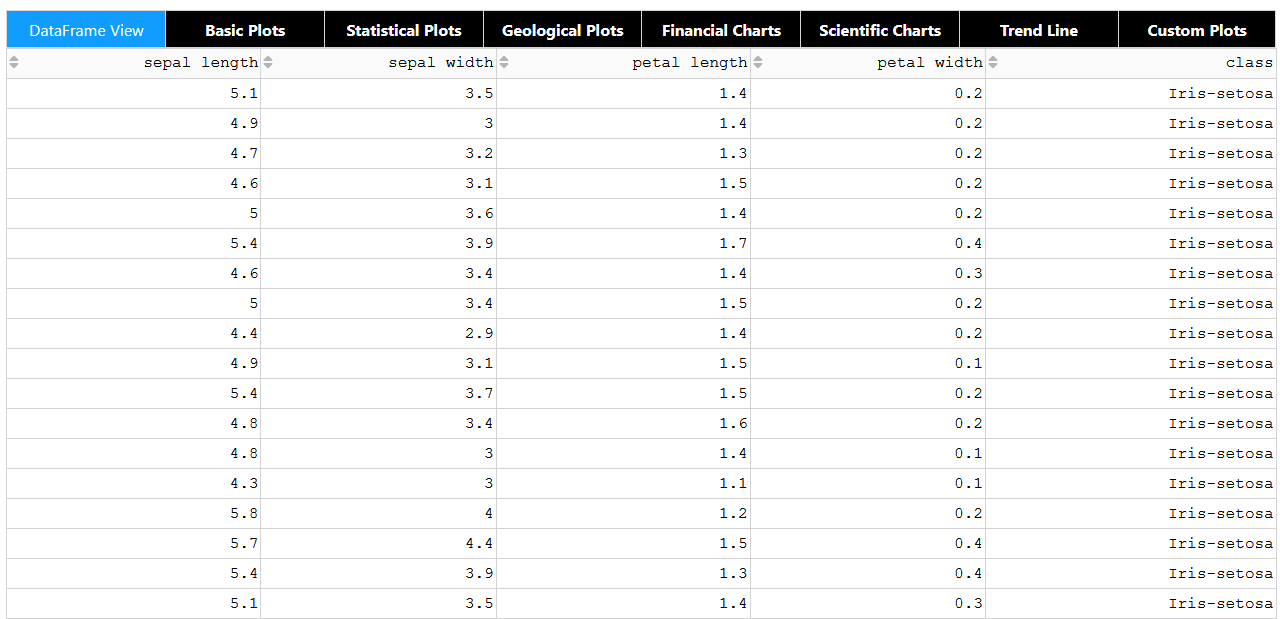
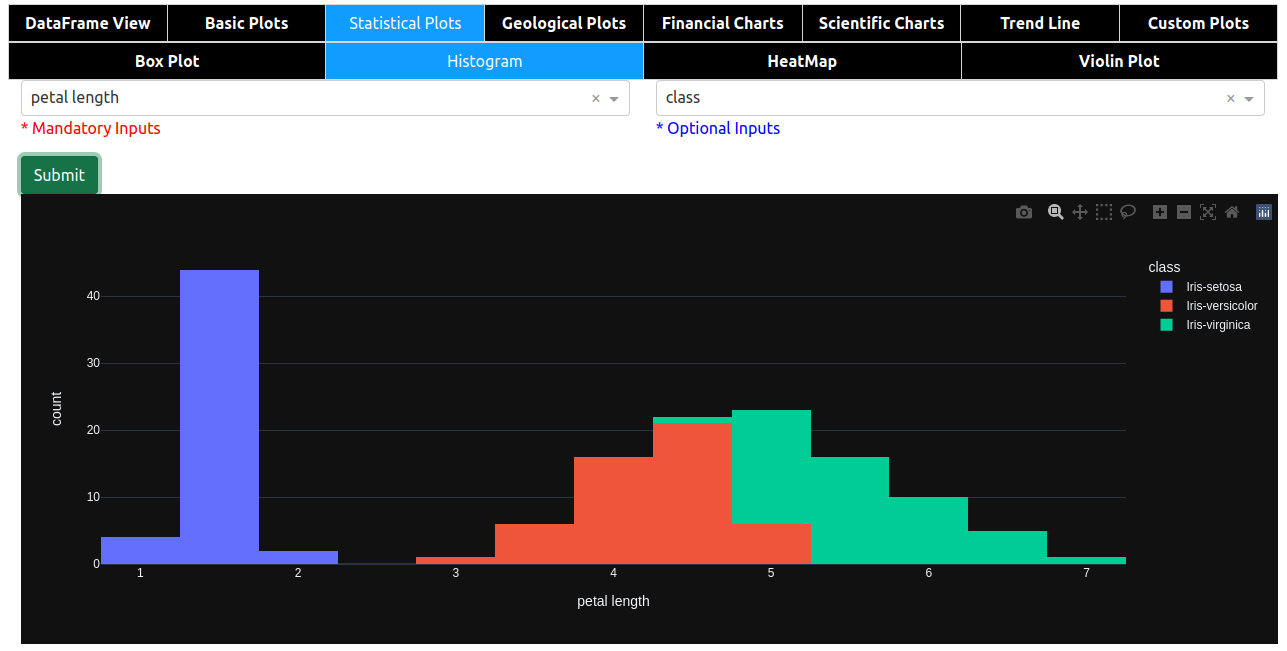
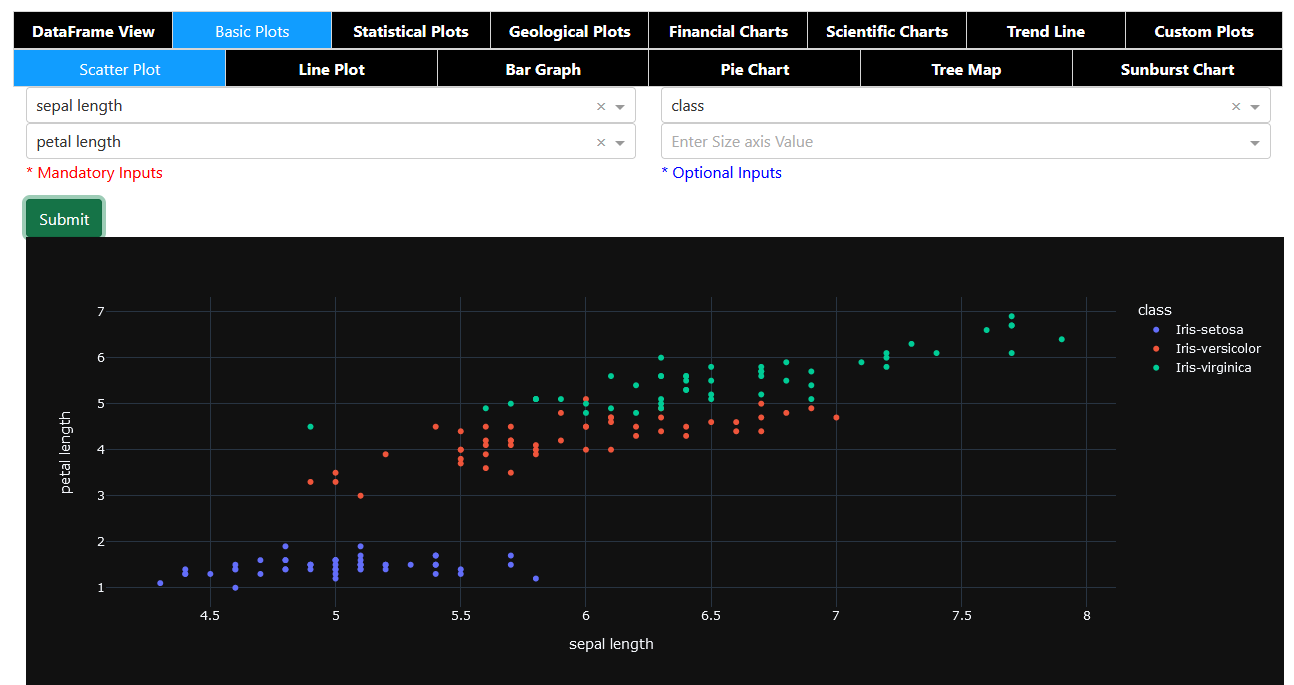
YOPO is an interactive dashboard which generates various standard plots.

Overview

YOPO (You Only Plot Once)

Python Plotly Flask

You Only Plot Once

YOPO is an interactive dashboard which generates various standard plots.you can create various graphs and charts with a click of a button. This tool uses Dash and Flask in backend.

Table of contents

Installing YOPO

To install from PyPi:

pip install yopo

To install from source:

cd <your_project>
git clone https://github.com/chekoduadarsh/YOPO-You-Only-Plot-Once.git
# or download and unzip https://github.com/AutoViML/AutoViz/archive/master.zip
# if you dont have virtualenv install from here https://packaging.python.org/en/latest/guides/installing-using-pip-and-virtual-environments/
python3 -m venv env
source env/bin/activate
git clone https://github.com/chekoduadarsh/YOPO-You-Only-Plot-Once.git
# or download and unzip https://github.com/AutoViML/AutoViz/archive/master.zip
cd yopo
python3 -m pip install .

Usage

its very easy to use YOPO, u just need to pass the dataframe and it will generate the dashboard.

A code like this will generate multiple plots like given below.

Contribute

If you find any error or need support please raise a issue. If you think you can add a feature, or help solve a bug please raise a PR This repo welcomes any kind of contributions pray

Feel free to adapt it criticize it and support it the way you like!!

License

Apache License, Version 2.0

You might also like...
This package creates clean and beautiful matplotlib plots that work on light and dark backgrounds

This package creates clean and beautiful matplotlib plots that work on light and dark backgrounds. Inspired by the work of Edward Tufte.

Moscow DEG 2021 elections plots

Построение графиков на основе публичных данных о ДЭГ в Москве в 2021г. Описание Скрипты в данном репозитории позволяют собственноручно построить графи

This plugin plots the time you spent on a tag as a histogram.

This plugin plots the time you spent on a tag as a histogram.

A minimal Python package that produces slice plots through h5m DAGMC geometry files

A minimal Python package that produces slice plots through h5m DAGMC geometry files Installation pip install dagmc_geometry_slice_plotter Python API U

MPL Plotter is a Matplotlib based Python plotting library built with the goal of delivering publication-quality plots concisely.

MPL Plotter is a Matplotlib based Python plotting library built with the goal of delivering publication-quality plots concisely.

Generate
Generate "Jupiter" plots for circular genomes

jupiter Generate "Jupiter" plots for circular genomes Description Python scripts to generate plots from ViennaRNA output. Written in "pidgin" python w

A Python function that makes flower plots.

Flower plot A Python 3.9+ function that makes flower plots. Installation This package requires at least Python 3.9. pip install

Standardized plots and visualizations in Python

Standardized plots and visualizations in Python pltviz is a Python package for standardized visualization. Routine and novel plotting approaches are f

The plottify package is makes matplotlib plots more legible

plottify The plottify package is makes matplotlib plots more legible. It's a thin wrapper around matplotlib that automatically adjusts font sizes, sca

Comments
  • Add predefined palettes as dropdown.

    Add predefined palettes as dropdown.

    Is your feature request related to a problem? An enhancement: to give the possibility to choose a color palette from a dropdown menu.

    There are too many predefined palettes at [https://plotly.com/python/builtin-colorscales/](https://plotly.com/python/builtin-colorscales/, and the menu would become too long), so a dozen should be enough.

    As a palette list I would consider:

    • Viridis
    • Magma
    • Turbo
    • Bluered
    • Hot
    • RdBu
    • YlOrRd
    • Thermal
    • Agsunset
    • Balance
    • Portland
    • Edge

    If the dropdown menu shows the palette colors (each image can be downloaded from the page) together with the name, it becomes very intuitive.

    enhancement 
    opened by Nemecsek 4
  • Give the possibility to add extra parameters.

    Give the possibility to add extra parameters.

    Is your feature request related to a problem? I am using Histograms, but the number of bins is automatic and cannot be changed. Other plot types can be optimized by adding extra parameters (i.e. to change the size of scatterplots' markers).

    Describe the solution you'd like Of course it is not possible to add parameters according to every users' needs.

    The easiest solution is to give the possibility to enter extra params into an edit box such as: Screenshot_20220218_092905

    This string can be transformed into a dictionary with eval(f'dict({ edit_box_content })'), and the dictionary then added to the plots' parameters.

    enhancement 
    opened by Nemecsek 2
  • Dataframe's index is missing among the selectable fields in X axis

    Dataframe's index is missing among the selectable fields in X axis

    As for the title, it is not possible to directly select the (unnamed) index among the X axis fields. Index is the most obvious choice for Y axis in Scatter, Line, etc.

    opened by Nemecsek 0
  • Let multiple series to be visualized in a single plot.

    Let multiple series to be visualized in a single plot.

    In Scatter, Line, Bar (and possibly other plots) it would be nice to visualize multiple series on the same figure. This would mean to select not only a single Y axis value, but to allow multiple selections (at least one).

    To keep things simple, I would draw all of them on the same figure, avoiding at the moment to provide sub figures.

    enhancement 
    opened by Nemecsek 1
Releases(alpha)
  • alpha(Feb 15, 2022)

Owner
ADARSH C
Python | Machine Learning | Deep Learning | Flask | mongodb | Embedded systems
ADARSH C
A deceptively simple plotting library for Streamlit

🍅 Plost A deceptively simple plotting library for Streamlit. Because you've been writing plots wrong all this time. Getting started pip install plost

Thiago Teixeira 192 Dec 29, 2022
A Python wrapper of Neighbor Retrieval Visualizer (NeRV)

PyNeRV A Python wrapper of the dimensionality reduction algorithm Neighbor Retrieval Visualizer (NeRV) Compile Set up the paths in Makefile then make.

2 Aug 29, 2021
Example scripts for generating plots of Bohemian matrices

Bohemian Eigenvalue Plotting Examples This repository contains examples of generating plots of Bohemian eigenvalues. The examples in this repository a

Bohemian Matrices 5 Nov 12, 2022
Simple Python interface for Graphviz

Simple Python interface for Graphviz

Sebastian Bank 1.3k Dec 26, 2022
A gui application to visualize various sorting algorithms using pure python.

Sorting Algorithm Visualizer A gui application to visualize various sorting algorithms using pure python. Language : Python 3 Libraries required Tkint

Rajarshi Banerjee 19 Nov 30, 2022
Make sankey, alluvial and sankey bump plots in ggplot

The goal of ggsankey is to make beautiful sankey, alluvial and sankey bump plots in ggplot2

David Sjoberg 156 Jan 03, 2023
Small U-Net for vehicle detection

Small U-Net for vehicle detection Vivek Yadav, PhD Overview In this repository , we will go over using U-net for detecting vehicles in a video stream

Vivek Yadav 91 Nov 03, 2022
Simple and fast histogramming in Python accelerated with OpenMP.

pygram11 Simple and fast histogramming in Python accelerated with OpenMP with help from pybind11. pygram11 provides functions for very fast histogram

Doug Davis 28 Dec 14, 2022
Fast scatter density plots for Matplotlib

About Plotting millions of points can be slow. Real slow... 😴 So why not use density maps? ⚡ The mpl-scatter-density mini-package provides functional

Thomas Robitaille 473 Dec 12, 2022
股票行情实时数据接口-A股,完全免费的沪深证券股票数据-中国股市,python最简封装的API接口

股票行情实时数据接口-A股,完全免费的沪深证券股票数据-中国股市,python最简封装的API接口,包含日线,历史K线,分时线,分钟线,全部实时采集,系统包括新浪腾讯双数据核心采集获取,自动故障切换,STOCK数据格式成DataFrame格式,可用来查询研究量化分析,股票程序自动化交易系统.为量化研究者在数据获取方面极大地减轻工作量,更加专注于策略和模型的研究与实现。

dev 572 Jan 08, 2023
Lumen provides a framework for visual analytics, which allows users to build data-driven dashboards from a simple yaml specification

Lumen project provides a framework for visual analytics, which allows users to build data-driven dashboards from a simple yaml specification

HoloViz 120 Jan 04, 2023
With Holoviews, your data visualizes itself.

HoloViews Stop plotting your data - annotate your data and let it visualize itself. HoloViews is an open-source Python library designed to make data a

HoloViz 2.3k Jan 04, 2023
JSNAPY example: Validate NAT policies

JSNAPY example: Validate NAT policies Overview This example will show how to use JSNAPy to make sure the expected NAT policy matches are taking place.

Calvin Remsburg 1 Jan 07, 2022
kyle's vision of how datadog's python client should look

kyle's datadog python vision/proposal not for production use See examples/comprehensive.py for a mostly working example of the proposed API. 📈 🐶 ❤️

Kyle Verhoog 2 Nov 21, 2021
An interactive GUI for WhiteboxTools in a Jupyter-based environment

whiteboxgui An interactive GUI for WhiteboxTools in a Jupyter-based environment GitHub repo: https://github.com/giswqs/whiteboxgui Documentation: http

Qiusheng Wu 105 Dec 15, 2022
Python scripts to manage Chia plots and drive space, providing full reports. Also monitors the number of chia coins you have.

Chia Plot, Drive Manager & Coin Monitor (V0.5 - April 20th, 2021) Multi Server Chia Plot and Drive Management Solution Be sure to ⭐ my repo so you can

338 Nov 25, 2022
Generate "Jupiter" plots for circular genomes

jupiter Generate "Jupiter" plots for circular genomes Description Python scripts to generate plots from ViennaRNA output. Written in "pidgin" python w

Robert Edgar 2 Nov 29, 2021
An(other) implementation of JSON Schema for Python

jsonschema jsonschema is an implementation of JSON Schema for Python. from jsonschema import validate # A sample schema, like what we'd get f

Julian Berman 4k Jan 04, 2023
Streamlit-template - A streamlit app template based on streamlit-option-menu

streamlit-template A streamlit app template for geospatial applications based on

Qiusheng Wu 41 Dec 10, 2022
Lime: Explaining the predictions of any machine learning classifier

lime This project is about explaining what machine learning classifiers (or models) are doing. At the moment, we support explaining individual predict

Marco Tulio Correia Ribeiro 10.3k Dec 29, 2022