Data-sets from the survey and analysis

Overview

bachelor-thesis

"Umfragewerte.xlsx" contains the orginal survey results. "umfrage_alle.csv" contains the survey results but one participant is canceled due to response to the survey before publication time (trial run). Additionally the coloumn names have been changed to a nomenclatur-scheme which is used in the analysis part of the bachelor-thesis, describing the compared maps.

bar_all.py includes var_all.png

bar_laien_vs_erf_vs_exp.py includes bar_mittlere_std

For some plots the installation of "altair" is necessary. Using Sypder (Python 3.9) its necessary to enable the "altair_viewer" (delete the # in line 4) in all_vs_all.py using:

alt.renderers.enable('altair_viewer')

Altair can be installed, along with the example datasets in vega_datasets, using:

$ pip install altair vega_datasets $ pip install altair_viewer

If you are using the conda package manager, the equivalent is:

$ conda install -c conda-forge altair vega_datasets

You might also like...
A collection of learning outcomes data analysis using Python and SQL, from DQLab.

Data Analyst with PYTHON Data Analyst berperan dalam menghasilkan analisa data serta mempresentasikan insight untuk membantu proses pengambilan keputu

This tool parses log data and allows to define analysis pipelines for anomaly detection.

logdata-anomaly-miner This tool parses log data and allows to define analysis pipelines for anomaly detection. It was designed to run the analysis wit

 A real data analysis and modeling project - restaurant inspections
A real data analysis and modeling project - restaurant inspections

A real data analysis and modeling project - restaurant inspections Jafar Pourbemany 9/27/2021 This project represents data analysis and modeling of re

Tools for the analysis, simulation, and presentation of Lorentz TEM data.

ltempy ltempy is a set of tools for Lorentz TEM data analysis, simulation, and presentation. Features Single Image Transport of Intensity Equation (SI

Driver Analysis with Factors and Forests: An Automated Data Science Tool using Python

Driver Analysis with Factors and Forests: An Automated Data Science Tool using Python πŸ“Š

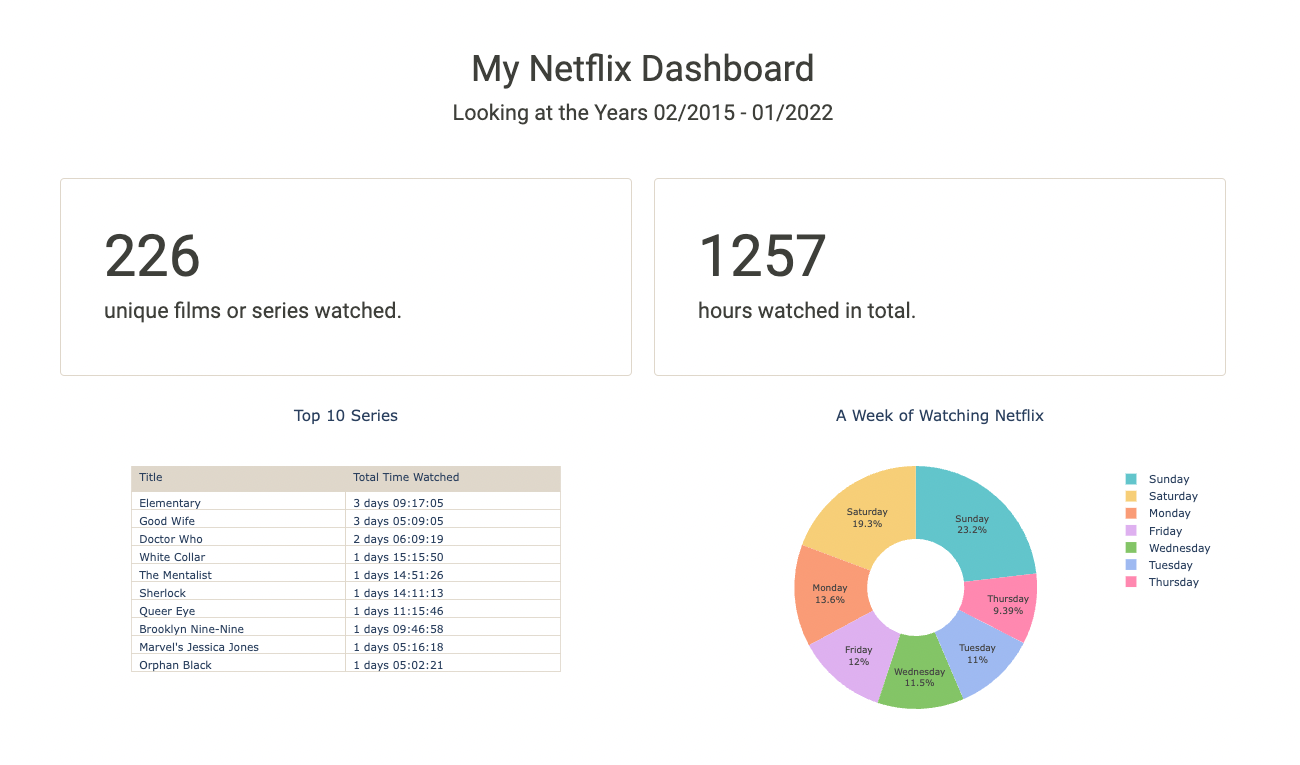
Project: Netflix Data Analysis and Visualization with Python

Project: Netflix Data Analysis and Visualization with Python Table of Contents General Info Installation Demo Usage and Main Functionalities Contribut

Amundsen is a metadata driven application for improving the productivity of data analysts, data scientists and engineers when interacting with data.

Amundsen is a metadata driven application for improving the productivity of data analysts, data scientists and engineers when interacting with data.

Flenser is a simple, minimal, automated exploratory data analysis tool.

Flenser Have you ever been handed a dataset you've never seen before? Flenser is a simple, minimal, automated exploratory data analysis tool. It runs

Visions provides an extensible suite of tools to support common data analysis operations

Visions And these visions of data types, they kept us up past the dawn. Visions provides an extensible suite of tools to support common data analysis

Renato 214 Jan 02, 2023
Template for a Dataflow Flex Template in Python

Dataflow Flex Template in Python This repository contains a template for a Dataflow Flex Template written in Python that can easily be used to build D

STOIX 5 Apr 28, 2022
ForecastGA is a Python tool to forecast Google Analytics data using several popular time series models.

ForecastGA is a tool that combines a couple of popular libraries, Atspy and googleanalytics, with a few enhancements.

JR Oakes 36 Jan 03, 2023
A Pythonic introduction to methods for scaling your data science and machine learning work to larger datasets and larger models, using the tools and APIs you know and love from the PyData stack (such as numpy, pandas, and scikit-learn).

This tutorial's purpose is to introduce Pythonistas to methods for scaling their data science and machine learning work to larger datasets and larger models, using the tools and APIs they know and lo

Coiled 102 Nov 10, 2022
PyClustering is a Python, C++ data mining library.

pyclustering is a Python, C++ data mining library (clustering algorithm, oscillatory networks, neural networks). The library provides Python and C++ implementations (C++ pyclustering library) of each

Andrei Novikov 1k Jan 05, 2023
Convert tables stored as images to an usable .csv file

Convert an image of numbers to a .csv file This Python program aims to convert images of array numbers to corresponding .csv files. It uses OpenCV for

711 Dec 26, 2022
A real-time financial data streaming pipeline and visualization platform using Apache Kafka, Cassandra, and Bokeh.

Realtime Financial Market Data Visualization and Analysis Introduction This repo shows my project about real-time stock data pipeline. All the code is

6 Sep 07, 2022
General Assembly's 2015 Data Science course in Washington, DC

DAT8 Course Repository Course materials for General Assembly's Data Science course in Washington, DC (8/18/15 - 10/29/15). Instructor: Kevin Markham (

Kevin Markham 1.6k Jan 07, 2023
Zipline, a Pythonic Algorithmic Trading Library

Zipline is a Pythonic algorithmic trading library. It is an event-driven system for backtesting. Zipline is currently used in production as the backte

Quantopian, Inc. 15.7k Jan 07, 2023
A lightweight interface for reading in output from the Weather Research and Forecasting (WRF) model into xarray Dataset

xwrf A lightweight interface for reading in output from the Weather Research and Forecasting (WRF) model into xarray Dataset. The primary objective of

National Center for Atmospheric Research 43 Nov 29, 2022
TheMachineScraper πŸ±β€πŸ‘€ is an Information Grabber built for Machine Analysis

TheMachineScraper πŸ±β€πŸ‘€ is a tool made purely for analysing machine data for any reason.

doop 5 Dec 01, 2022
PandaPy has the speed of NumPy and the usability of Pandas 10x to 50x faster (by @firmai)

PandaPy "I came across PandaPy last week and have already used it in my current project. It is a fascinating Python library with a lot of potential to

Derek Snow 527 Jan 02, 2023
🌍 Create 3d-printable STLs from satellite elevation data 🌏

mapa 🌍 Create 3d-printable STLs from satellite elevation data Installation pip install mapa Usage mapa uses numpy and numba under the hood to crunch

Fabian Gebhart 13 Dec 15, 2022
The Spark Challenge Student Check-In/Out Tracking Script

The Spark Challenge Student Check-In/Out Tracking Script This Python Script uses the Student ID Database to match the entries with the ID Card Swipe a

1 Dec 09, 2021
Extract Thailand COVID-19 Cluster data from daily briefing pdf.

Thailand COVID-19 Cluster Data Extraction About Extract Clusters from Thailand Daily COVID-19 briefing PDF Download latest data Here. Data will be upd

Noppakorn Jiravaranun 5 Sep 27, 2021
An Indexer that works out-of-the-box when you have less than 100K stored Documents

U100KIndexer An Indexer that works out-of-the-box when you have less than 100K stored Documents. U100K means under 100K. At 100K stored Documents with

Jina AI 7 Mar 15, 2022
Evaluation of a Monocular Eye Tracking Set-Up

Evaluation of a Monocular Eye Tracking Set-Up As part of my master thesis, I implemented a new state-of-the-art model that is based on the work of Che

Pascal 19 Dec 17, 2022
Elementary is an open-source data reliability framework for modern data teams. The first module of the framework is data lineage.

Data lineage made simple, reliable, and automated. Effortlessly track the flow of data, understand dependencies and analyze impact. Features Visualiza

898 Jan 09, 2023
A utility for functional piping in Python that allows you to access any function in any scope as a partial.

WithPartial Introduction WithPartial is a simple utility for functional piping in Python. The package exposes a context manager (used with with) calle

Michael Milton 1 Oct 26, 2021
Learn machine learning the fun way, with Oracle and RedBull Racing

Red Bull Racing Analytics Hands-On Labs Introduction Are you interested in learning machine learning (ML)? How about doing this in the context of the

Oracle DevRel 55 Oct 24, 2022