Project: Netflix Data Analysis and Visualization with Python

Overview

Project: Netflix Data Analysis and Visualization with Python

MyNetflixDashboard

Table of Contents

  1. General Info
  2. Installation
  3. Demo
  4. Usage and Main Functionalities
  5. Contributing

General Info

This is a compact Data Visualization project I worked on for fun and to deepen my knowledge about visualizations and graphs using python libraries.

From conception and design to every line of code, the entire Dashboard was worked on by myself. During this project, I was able to repeat and deepen what I had previously learned in my Data Science course of study. Especially, I was able to familiarize myself with pandas and work on my data visualization skills, which I greatly enjoied!

The dataset I used for the Netflix data analytics task consists of my personal Netflix data, which I requested through their website. You can get access to your own data through this link. Feel free to download it and use my code to look into your own viewing behaviour :)

Installation

Requirements: Make sure you have Python 3.7+ installed on your computer. You can download the latest version of Python here.

Req. Packages:

  • pandas
  • dash
  • dash_bootstrap_components
  • ploty.express
  • plotly.graph_objects

Demo

Demo_MyNetflixDashboard_komprimiert.mov

Usage and Main Functionalities

Want to know more about your own Netflix behaviour? For test usage you can download your own Netflix data. Just follow this link and Netflix will send you your personal data.

Please also refer to the comments within the code itself to get more information on the functionalities of the program.


0. Preparing the data for analysis

  • This part cleans up the original data and prepares it for analysis.
  • In the process, columns that are not needed are dropped.
  • Time data is converted into appropriate time formats and split into several columns. The days of the week are added.
  • In addition, the titles of the movies/series are split (title, season number, episode name).

1. Analysis

  • This part of the code is about analyzing the data.
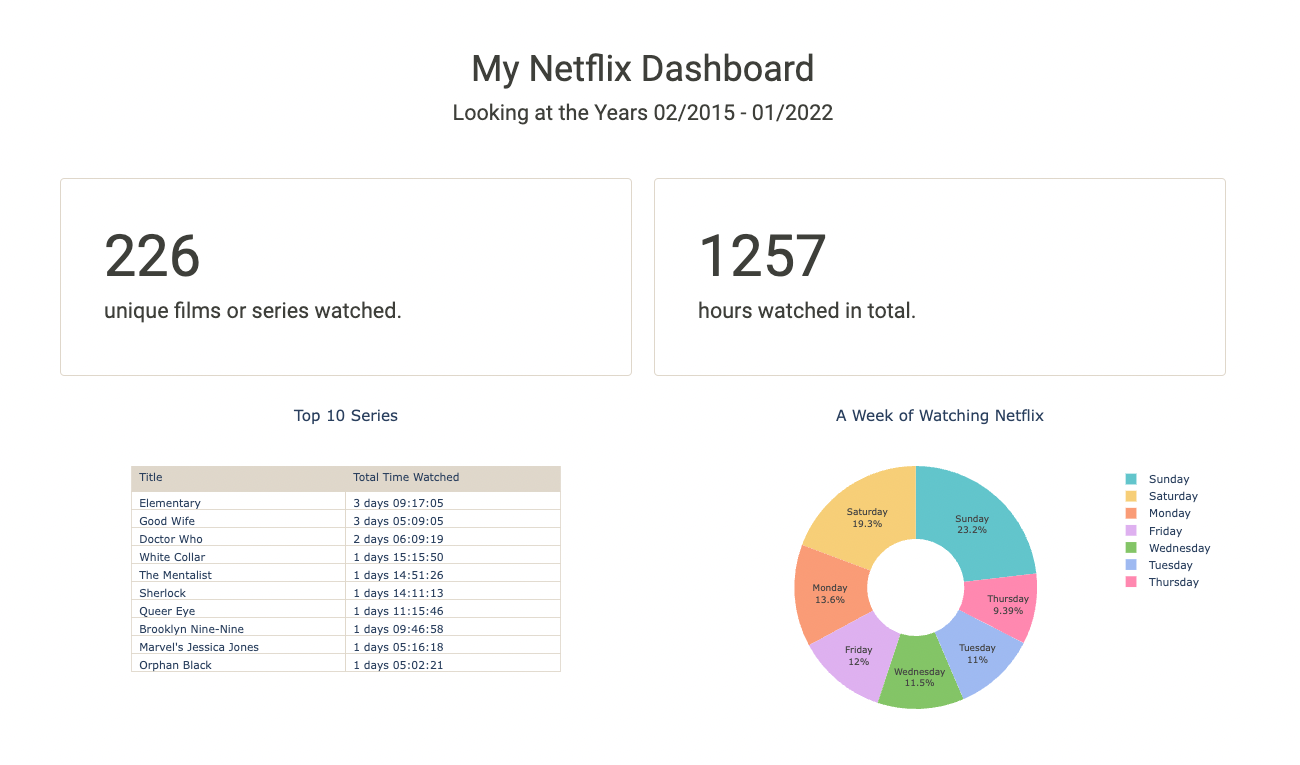
  • We find out how many movies or series were watched over the entire period. We also count the total number of hours Netflix was watched.
  • A pie chart is created that shows which days of the week are watched.
  • In addition, the top 10 series that were watched the longest (in terms of total duration) are displayed.
  • A line chart shows Netflix viewing behavior over the years, counting the total number of hours Netflix was watched.

NetflixOverTime

2. Dash App Layout

  • plotly's Dash is now used to create an Interactive Dashboard of Netflix data.
  • The individual graphics and texts are arranged in rows and containers.
  • This part also includes a dropdown menu that the user can interact with.

3. App Callback

  • Here we connect an interactive bar chart to the Dash Components.
  • The chart represents our total annual hours of Netflix watched, grouped by month. The chart is filterable by year.

MonthlyViews

Contributing

Your comments, suggestions, and contributions are welcome. Please feel free to contribute pull requests or create issues for bugs and feature requests.
Owner
Kathrin Hälbich
Data Science Student and PR- & Marketing-Expert
Kathrin Hälbich
A model checker for verifying properties in epistemic models

Epistemic Model Checker This is a model checker for verifying properties in epistemic models. The goal of the model checker is to check for Pluralisti

Thomas Träff 2 Dec 22, 2021
collect training and calibration data for gaze tracking

Collect Training and Calibration Data for Gaze Tracking This tool allows collecting gaze data necessary for personal calibration or training of eye-tr

Pascal 5 Dec 17, 2022
Amundsen is a metadata driven application for improving the productivity of data analysts, data scientists and engineers when interacting with data.

Amundsen is a metadata driven application for improving the productivity of data analysts, data scientists and engineers when interacting with data.

Amundsen 3.7k Jan 03, 2023
Option Pricing Calculator using the Binomial Pricing Method (No Libraries Required)

Binomial Option Pricing Calculator Option Pricing Calculator using the Binomial Pricing Method (No Libraries Required) Background A derivative is a fi

sammuhrai 1 Nov 29, 2021
Aggregating gridded data (xarray) to polygons

A package to aggregate gridded data in xarray to polygons in geopandas using area-weighting from the relative area overlaps between pixels and polygons. Check out the binder link above for a sample c

Kevin Schwarzwald 42 Nov 09, 2022
A pipeline that creates consensus sequences from a Nanopore reads. I

A pipeline that creates consensus sequences from a Nanopore reads. It clusters reads that are similar to each other and creates a consensus that is then identified using BLAST.

Ada Madejska 2 May 15, 2022
Predictive Modeling & Analytics on Home Equity Line of Credit

Predictive Modeling & Analytics on Home Equity Line of Credit Data (Python) HMEQ Data Set In this assignment we will use Python to examine a data set

Dhaval Patel 1 Jan 09, 2022
Pipeline to convert a haploid assembly into diploid

HapDup (haplotype duplicator) is a pipeline to convert a haploid long read assembly into a dual diploid assembly. The reconstructed haplotypes

Mikhail Kolmogorov 50 Jan 05, 2023
Dbt-core - dbt enables data analysts and engineers to transform their data using the same practices that software engineers use to build applications.

Dbt-core - dbt enables data analysts and engineers to transform their data using the same practices that software engineers use to build applications.

dbt Labs 6.3k Jan 08, 2023
An implementation of the largeVis algorithm for visualizing large, high-dimensional datasets, for R

largeVis This is an implementation of the largeVis algorithm described in (https://arxiv.org/abs/1602.00370). It also incorporates: A very fast algori

336 May 25, 2022
Galvanalyser is a system for automatically storing data generated by battery cycling machines in a database

Galvanalyser is a system for automatically storing data generated by battery cycling machines in a database, using a set of "harvesters", whose job it

Battery Intelligence Lab 20 Sep 28, 2022
BErt-like Neurophysiological Data Representation

BENDR BErt-like Neurophysiological Data Representation This repository contains the source code for reproducing, or extending the BERT-like self-super

114 Dec 23, 2022
ICLR 2022 Paper submission trend analysis

Visualize ICLR 2022 OpenReview Data

Jintang Li 75 Dec 06, 2022
Data science/Analysis Health Care Portfolio

Health-Care-DS-Projects Data Science/Analysis Health Care Portfolio Consists Of 3 Projects: Mexico Covid-19 project, analyze the patient medical histo

Mohamed Abd El-Mohsen 1 Feb 13, 2022
This python script allows you to manipulate the audience data from Sl.ido surveys

Slido-Automated-VoteBot This python script allows you to manipulate the audience data from Sl.ido surveys Since Slido blocks interference from automat

Pranav Menon 1 Jan 24, 2022
DefAP is a program developed to facilitate the exploration of a material's defect chemistry

DefAP is a program developed to facilitate the exploration of a material's defect chemistry. A large number of features are provided and rapid exploration is supported through the use of autoplotting

6 Oct 25, 2022
Titanic data analysis for python

Titanic-data-analysis This Repo is an analysis on Titanic_mod.csv This csv file contains some assumed data of the Titanic ship after sinking This full

Hardik Bhanot 1 Dec 26, 2021
A utility for functional piping in Python that allows you to access any function in any scope as a partial.

WithPartial Introduction WithPartial is a simple utility for functional piping in Python. The package exposes a context manager (used with with) calle

Michael Milton 1 Oct 26, 2021
Validated, scalable, community developed variant calling, RNA-seq and small RNA analysis

Validated, scalable, community developed variant calling, RNA-seq and small RNA analysis. You write a high level configuration file specifying your in

Blue Collar Bioinformatics 917 Jan 03, 2023