LabGraph is a a Python-first framework used to build sophisticated research systems with real-time streaming, graph API, and parallelism.

Overview

labgraph-interactive

LabGraph Interactive

Learning LabGraph online.

What is LabGraph?

LabGraph is a a Python-first framework used to build sophisticated research systems with real-time streaming, graph API, and parallelism. Facebook Researchers use it prototype wearable hardware systems and process digital signals under their VR/AR efforts into the Metaverse.

To put it simply, LabGraph sets the relationship between the inputs and outputs of computations and provides the needed tooling to run them in parallel to help developers focus on algorithms instead of the environment.

What is LabGraph Interactive?

As MLH Fellows who have not used LabGraph before, we had a hard time understanding its purpose, how to set it up correctly, and what to expect from the library. So we decided to help future MLH Fellows get up to speed both on concepts and usage with an interactive tool.

We built the interactive tool to let users get the taste of LabGraph with zero commitments. The interactive terminal lets the users run simulations we prepared with different numbers of features and see their expected outputs.

How to Use LabGraph Interactive?

  1. Navigate to the website hosted on GitHub Pages at mlh-fellowship.github.io/labgraph-interactive
  2. Type help into the terminal
  3. Run the commands you would like to try out
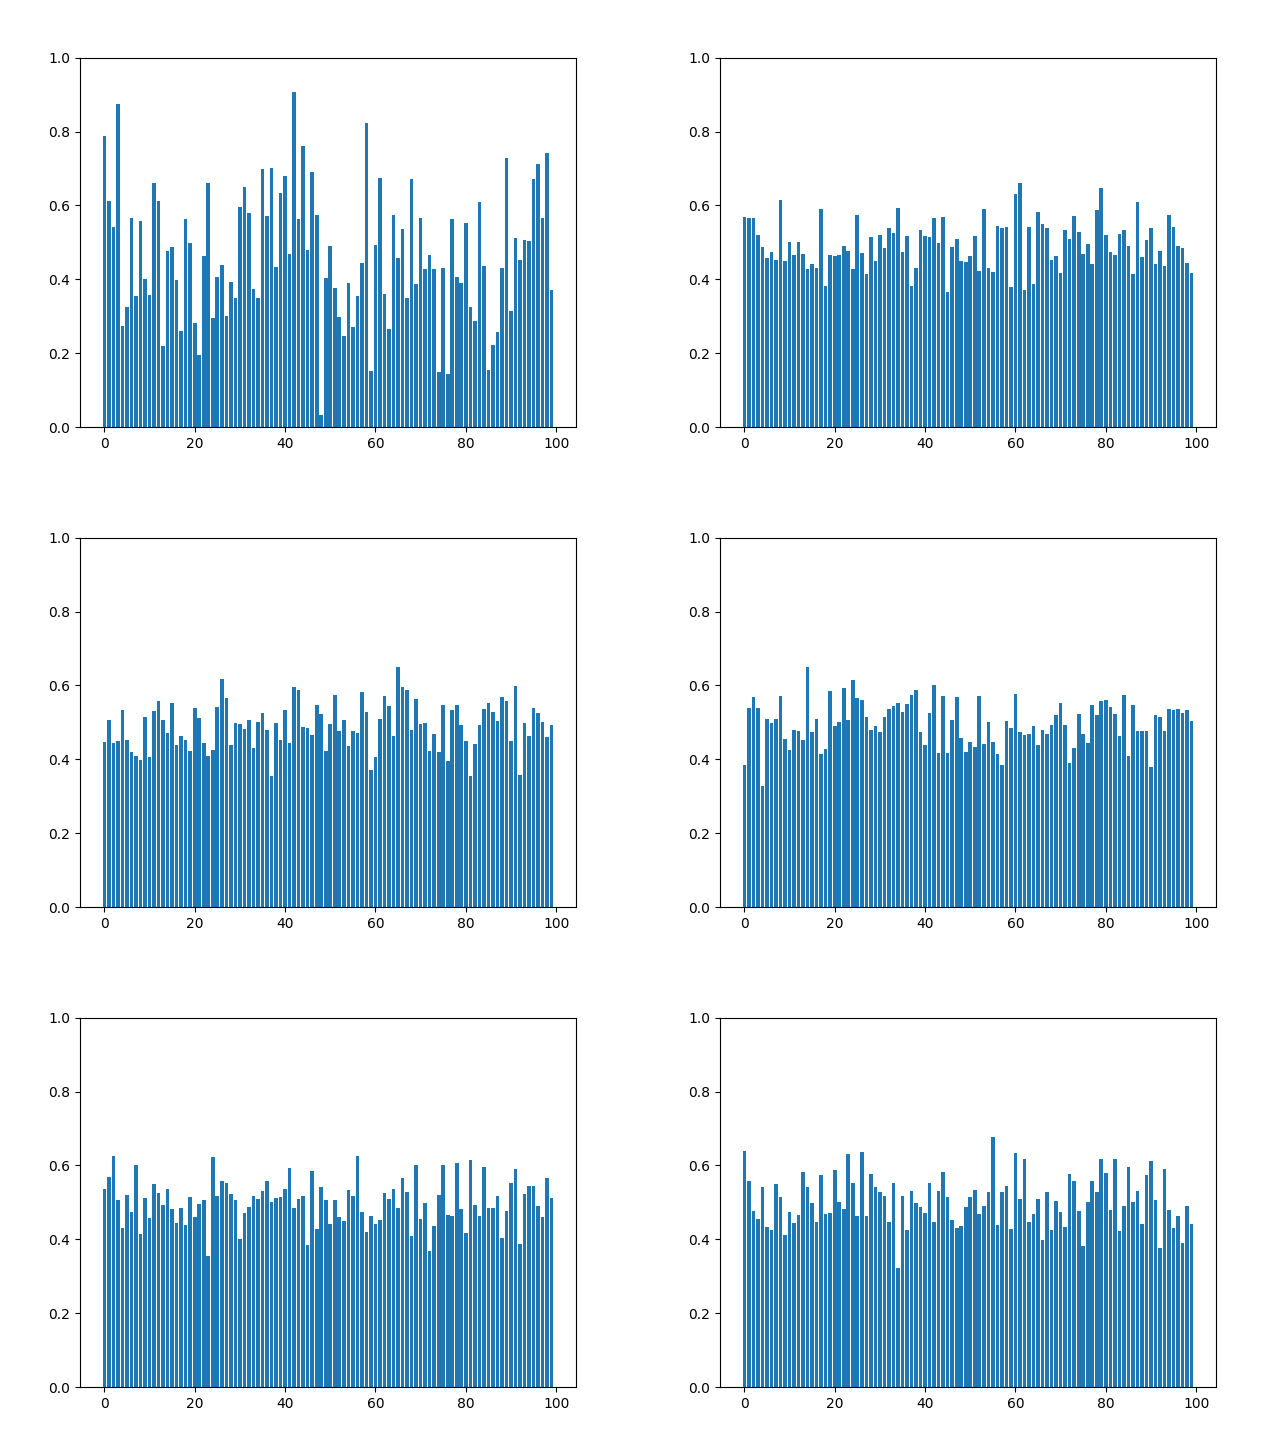
  4. Check the resulted graph built with random data

How to Use LabGraph?

To run LabGraph simulations on your machine, follow steps listed below:

  1. Run pip install labgraph to install LabGraph along with its dependecieis
  2. Run python setup.py install to work with the simulation we prepared and listed under random_labgraph/simulation.py
  3. Run python random_labgraph/simulation.py 100 to get a graph produced with LabGraph's node in real-time

License

This project is served unded the MIT License.

MIT License

Copyright (c) 2022 MLH Fellowship

Permission is hereby granted, free of charge, to any person obtaining a copy
of this software and associated documentation files (the "Software"), to deal
in the Software without restriction, including without limitation the rights
to use, copy, modify, merge, publish, distribute, sublicense, and/or sell
copies of the Software, and to permit persons to whom the Software is
furnished to do so, subject to the following conditions:

The above copyright notice and this permission notice shall be included in all
copies or substantial portions of the Software.

THE SOFTWARE IS PROVIDED "AS IS", WITHOUT WARRANTY OF ANY KIND, EXPRESS OR
IMPLIED, INCLUDING BUT NOT LIMITED TO THE WARRANTIES OF MERCHANTABILITY,
FITNESS FOR A PARTICULAR PURPOSE AND NONINFRINGEMENT. IN NO EVENT SHALL THE
AUTHORS OR COPYRIGHT HOLDERS BE LIABLE FOR ANY CLAIM, DAMAGES OR OTHER
LIABILITY, WHETHER IN AN ACTION OF CONTRACT, TORT OR OTHERWISE, ARISING FROM,
OUT OF OR IN CONNECTION WITH THE SOFTWARE OR THE USE OR OTHER DEALINGS IN THE
SOFTWARE.
Owner
MLH Fellowship
An internship alternative for software engineers, by Major League Hacking
MLH Fellowship
This GitHub Repository contains Data Analysis projects that I have completed so far! While most of th project are focused on Data Analysis, some of them are also put here to show off other skills that I have learned.

Welcome to my Data Analysis projects page! This GitHub Repository contains Data Analysis projects that I have completed so far! While most of th proje

Kyle Dini 1 Jan 31, 2022
Generate graphs with NetworkX, natively visualize with D3.js and pywebview

webview_d3 This is some PoC code to render graphs created with NetworkX natively using D3.js and pywebview. The main benifit of this approac

byt3bl33d3r 68 Aug 18, 2022
Visualization ideas for data science

Nuance I use Nuance to curate varied visualization thoughts during my data scientist career. It is not yet a package but a list of small ideas. Welcom

Li Jiangchun 16 Nov 03, 2022
An application that allows you to design and test your own stock trading algorithms in an attempt to beat the market.

StockBot is a Python application for designing and testing your own daily stock trading algorithms. Installation Use the

Ryan Cullen 280 Dec 19, 2022
🎨 Python Echarts Plotting Library

pyecharts Python ❤️ ECharts = pyecharts English README 📣 简介 Apache ECharts (incubating) 是一个由百度开源的数据可视化,凭借着良好的交互性,精巧的图表设计,得到了众多开发者的认可。而 Python 是一门富有表达

pyecharts 13.1k Jan 03, 2023
RockNext is an Open Source extending ERPNext built on top of Frappe bringing enterprise ready utilization.

RockNext is an Open Source extending ERPNext built on top of Frappe bringing enterprise ready utilization.

Matheus Breguêz 13 Oct 12, 2022
Flow-based visual scripting for Python

A simple visual node editor for Python Ryven combines flow-based visual scripting with Python. It gives you absolute freedom for your nodes and a simp

Leon Thomm 3.1k Jan 06, 2023
Generate visualizations of GitHub user and repository statistics using GitHub Actions.

GitHub Stats Visualization Generate visualizations of GitHub user and repository statistics using GitHub Actions. This project is currently a work-in-

JoelImgu 3 Dec 14, 2022
Visualize your pandas data with one-line code

PandasEcharts 简介 基于pandas和pyecharts的可视化工具 安装 pip 安装 $ pip install pandasecharts 源码安装 $ git clone https://github.com/gamersover/pandasecharts $ cd pand

陈华杰 2 Apr 13, 2022
Make your BSC transaction simple.

bsc_trade_history Make your BSC transaction simple. 中文ReadMe Background: inspired by debank ,Practice my hands on this small project Blog:Crypto-BscTr

foolisheddy 7 Jul 06, 2022
1900-2016 Olympic Data Analysis in Python by plotting different graphs

🔥 Olympics Data Analysis 🔥 In Data Science field, there is a big topic before creating a model for future prediction is Data Analysis. We can find o

Sayan Roy 1 Feb 06, 2022
3D rendered visualization of the austrian monuments registry

Visualization of the Austrian Monuments Visualization of the monument landscape of the austrian monuments registry (Bundesdenkmalamt Denkmalverzeichni

Nikolai Janakiev 3 Oct 24, 2019
An interactive GUI for WhiteboxTools in a Jupyter-based environment

whiteboxgui An interactive GUI for WhiteboxTools in a Jupyter-based environment GitHub repo: https://github.com/giswqs/whiteboxgui Documentation: http

Qiusheng Wu 105 Dec 15, 2022
Massively parallel self-organizing maps: accelerate training on multicore CPUs, GPUs, and clusters

Somoclu Somoclu is a massively parallel implementation of self-organizing maps. It exploits multicore CPUs, it is able to rely on MPI for distributing

Peter Wittek 239 Nov 10, 2022
With Holoviews, your data visualizes itself.

HoloViews Stop plotting your data - annotate your data and let it visualize itself. HoloViews is an open-source Python library designed to make data a

HoloViz 2.3k Jan 04, 2023
Dimensionality reduction in very large datasets using Siamese Networks

ivis Implementation of the ivis algorithm as described in the paper Structure-preserving visualisation of high dimensional single-cell datasets. Ivis

beringresearch 284 Jan 01, 2023
Quickly and accurately render even the largest data.

Turn even the largest data into images, accurately Build Status Coverage Latest dev release Latest release Docs Support What is it? Datashader is a da

HoloViz 2.9k Dec 28, 2022
Create animated and pretty Pandas Dataframe or Pandas Series

Rich DataFrame Create animated and pretty Pandas Dataframe or Pandas Series, as shown below: Installation pip install rich-dataframe Usage Minimal exa

Khuyen Tran 92 Dec 26, 2022
A Scheil-Gulliver simulation tool using pycalphad.

scheil A Scheil-Gulliver simulation tool using pycalphad. import matplotlib.pyplot as plt from pycalphad import Database, variables as v from scheil i

pycalphad 6 Dec 10, 2021
Open-source demos hosted on Dash Gallery

Dash Sample Apps This repository hosts the code for over 100 open-source Dash apps written in Python or R. They can serve as a starting point for your

Plotly 2.7k Jan 07, 2023