Tweets your monthly GitHub Contributions as Wordle grid

Overview

wordle-github-contributions

Tweets your monthly GitHub Contributions as Wordle grid

kizie-1488349199779389443

with tweepy support

name: Wordle GitHub Contributions

on:
  schedule:
    # at 08:00 on day-of-month 1
    - cron: "0 8 1 * *"

jobs:
  tweet-contribution-chart:
    runs-on: ubuntu-latest
    steps:
      - uses: actions/[email protected]
      - uses: vchrombie/[email protected]
        env:
          GH_TOKEN: ${{ secrets.GITHUB_TOKEN }}
          TWITTER_CONSUMER_KEY: ${{ secrets.TWITTER_CONSUMER_KEY }}
          TWITTER_CONSUMER_SECRET: ${{ secrets.TWITTER_CONSUMER_SECRET }}
          TWITTER_ACCESS_TOKEN: ${{ secrets.TWITTER_ACCESS_TOKEN }}
          TWITTER_ACCESS_TOKEN_SECRET: ${{ secrets.TWITTER_ACCESS_TOKEN_SECRET }}
You might also like...
Python script for writing text on github contribution chart.

Github Contribution Drawer Python script for writing text on github contribution chart. Requirements Python 3.X Getting Started Create repository Put

Visualise top-rated GitHub repositories in a barchart by keyword

This python script was written for simple purpose -- to visualise top-rated GitHub repositories in a barchart by keyword. Script generates html-page with barchart and information about repository owner, description, create date and update date.

OpenStats is a library built on top of streamlit that extracts data from the Github API and shows the main KPIs

Open Stats Discover and share the KPIs of your OpenSource project. OpenStats is a library built on top of streamlit that extracts data from the Github

Automatically generate GitHub activity!

Commit Bot Automatically generate GitHub activity! We've all wanted to be the developer that commits every day, but that requires a lot of work. Let's

Create Badges with stats of Scratch User, Project and Studio. Use those badges in Github readmes, etc.

Scratch-Stats-Badge Create customized Badges with stats of Scratch User, Studio or Project. Use those badges in Github readmes, etc. Examples Document

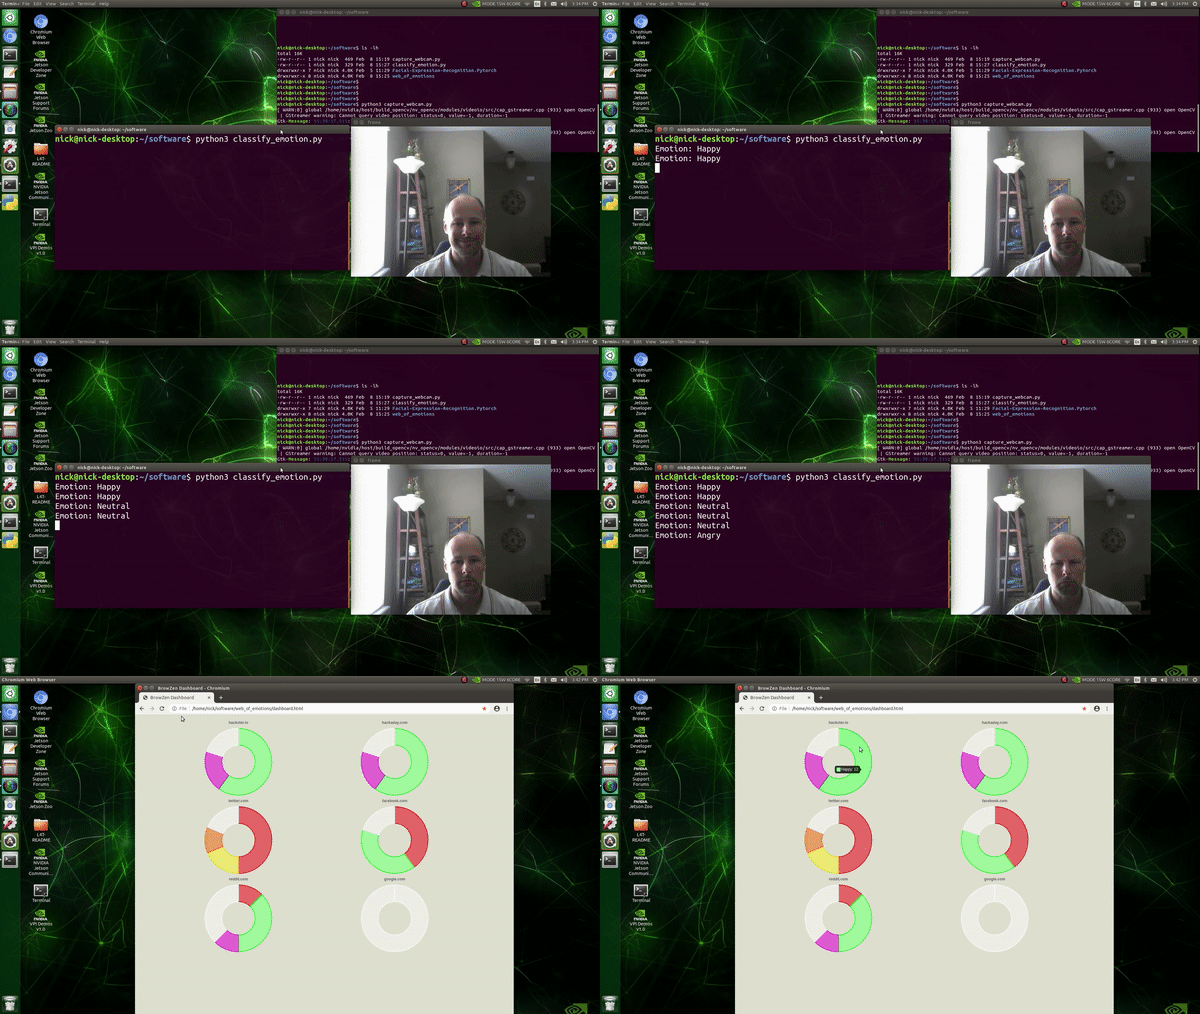
BrowZen correlates your emotional states with the web sites you visit to give you actionable insights about how you spend your time browsing the web.

BrowZen BrowZen correlates your emotional states with the web sites you visit to give you actionable insights about how you spend your time browsing t

An application that allows you to design and test your own stock trading algorithms in an attempt to beat the market.

StockBot is a Python application for designing and testing your own daily stock trading algorithms. Installation Use the

With Holoviews, your data visualizes itself.

HoloViews Stop plotting your data - annotate your data and let it visualize itself. HoloViews is an open-source Python library designed to make data a

With Holoviews, your data visualizes itself.

HoloViews Stop plotting your data - annotate your data and let it visualize itself. HoloViews is an open-source Python library designed to make data a

Releases(v0.2.0)
  • v0.2.0(Feb 15, 2022)

    New Features

    • f7650cb - Add support for adding custom hashtags to the tweet Now, you can add custom hashtags to your tweet. You need to define the hashtags in the workflow configuration file as a string.
            - uses: vchrombie/[email protected]
            with:
              HASHTAGS: 'wordle github contributions'
            env:
              GH_TOKEN: ${{ secrets.GITHUB_TOKEN }}
      

    Full Changelog: https://github.com/vchrombie/wordle-github-contributions/compare/v0.1.0...v0.2.0

    Source code(tar.gz)
    Source code(zip)
  • v0.1.0(Feb 14, 2022)

Owner
Venu Vardhan Reddy Tekula
Data Detective
Venu Vardhan Reddy Tekula
Data visualization electromagnetic spectrum

Datenvisualisierung-Elektromagnetischen-Spektrum Anhand des Moduls matplotlib sollen die Daten des elektromagnetischen Spektrums dargestellt werden. D

Pulsar 1 Sep 01, 2022
Visualizing weather changes across the world using third party APIs and Python.

WEATHER FORECASTING ACROSS THE WORLD Overview Python scripts were created to visualize the weather for over 500 cities across the world at varying di

G Johnson 0 Jun 12, 2021
Farhad Davaripour, Ph.D. 1 Jan 05, 2022
A Python-based non-fungible token (NFT) generator built using Samilla and Matplotlib

PyNFT A Pythonic NF (non-fungible token) generator built using Samilla and Matplotlib Use python pynft.py [amount] The intention behind this generato

Ayush Gundawar 6 Feb 07, 2022
This project is created to visualize the system statistics such as memory usage, CPU usage, memory accessible by process and much more using Kibana Dashboard with Elasticsearch.

System Stats Visualizer This project is created to visualize the system statistics such as memory usage, CPU usage, memory accessible by process and m

Vishal Teotia 5 Feb 06, 2022
An interactive UMAP visualization of the MNIST data set.

Code for an interactive UMAP visualization of the MNIST data set. Demo at https://grantcuster.github.io/umap-explorer/. You can read more about the de

grant 70 Dec 27, 2022
This is simply repo for line drawing rendering using freestyle in Blender.

blender_freestyle_line_drawing This is simply repo for line drawing rendering using freestyle in Blender. how to use blender2935 --background --python

MaxLin 3 Jul 02, 2022
Flow-based visual scripting for Python

A simple visual node editor for Python Ryven combines flow-based visual scripting with Python. It gives you absolute freedom for your nodes and a simp

Leon Thomm 3.1k Jan 06, 2023
Cartopy - a cartographic python library with matplotlib support

Cartopy is a Python package designed to make drawing maps for data analysis and visualisation easy. Table of contents Overview Get in touch License an

1.2k Jan 01, 2023
a python function to plot a geopandas dataframe

Pretty GeoDataFrame A minimum python function (~60 lines) to draw pretty geodataframe. Based on matplotlib, shapely, descartes. Installation just use

haoming 27 Dec 05, 2022
Tools for writing, submitting, debugging, and monitoring Storm topologies in pure Python

Petrel Tools for writing, submitting, debugging, and monitoring Storm topologies in pure Python. NOTE: The base Storm package provides storm.py, which

AirSage 247 Dec 18, 2021
Personal IMDB Graphs with Bokeh

Personal IMDB Graphs with Bokeh Do you like watching movies and also rate all of them in IMDB? Would you like to look at your IMDB stats based on your

2 Dec 15, 2021
UNMAINTAINED! Renders beautiful SVG maps in Python.

Kartograph is not maintained anymore As you probably already guessed from the commit history in this repo, Kartograph.py is not maintained, which mean

1k Dec 09, 2022
Python code for solving 3D structural problems using the finite element method

3DFEM Python 3D finite element code This python code allows for solving 3D structural problems using the finite element method. New features will be a

Rémi Capillon 6 Sep 29, 2022
DALLE-tools provided useful dataset utilities to improve you workflow with WebDatasets.

DALLE tools DALLE-tools is a github repository with useful tools to categorize, annotate or check the sanity of your datasets. Installation Just clone

11 Dec 25, 2022
Altair extension for saving charts in a variety of formats.

Altair Saver This packge provides extensions to Altair for saving charts to a variety of output types. Supported output formats are: .json/.vl.json: V

Altair 85 Dec 09, 2022
https://there.oughta.be/a/macro-keyboard

inkkeys Details and instructions can be found on https://there.oughta.be/a/macro-keyboard In contrast to most of my other projects, I decided to put t

Sebastian Staacks 209 Dec 21, 2022
A workshop on data visualization in Python with notebooks and exercises for following along.

Beyond the Basics: Data Visualization in Python The human brain excels at finding patterns in visual representations, which is why data visualizations

Stefanie Molin 162 Dec 05, 2022
Process dataframe in a easily way.

Popanda Written by Shengxuan Wang at OSU. Used for processing dataframe, especially for machine learning. The name is from "Po" in the movie Kung Fu P

ShawnWang 1 Dec 24, 2021
Sentiment Analysis application created with Python and Dash, hosted at socialsentiment.net

Social Sentiment Dash Application Live-streaming sentiment analysis application created with Python and Dash, hosted at SocialSentiment.net. Dash Tuto

Harrison 456 Dec 25, 2022