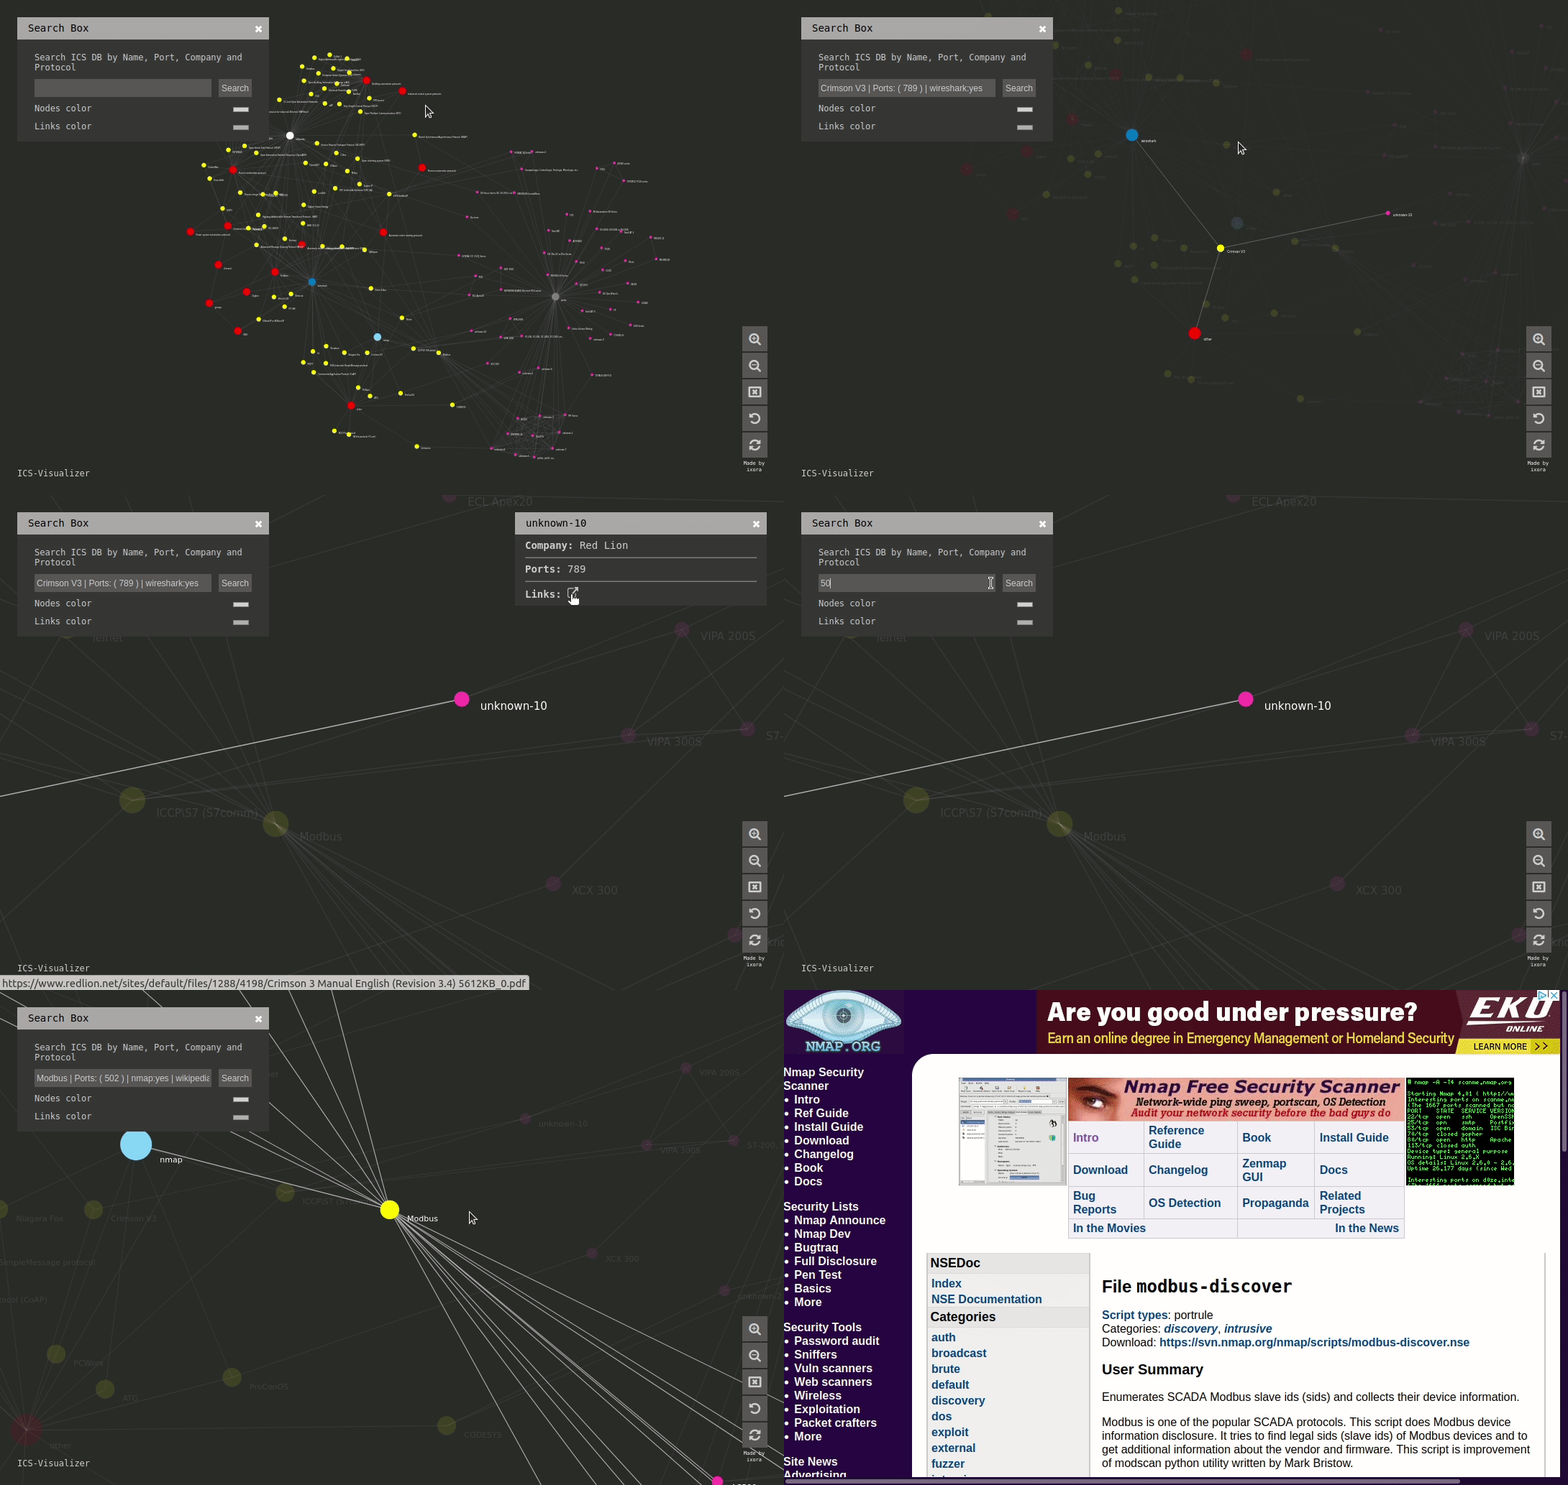
ICS-Visualizer is an interactive Industrial Control Systems (ICS) network graph that contains up-to-date ICS metadata

Overview

Generic badge Generic badge Generic badge Generic badge

ICS-Visualizer is an interactive Industrial Control Systems (ICS) network graph that contains up-to-date ICS metadata (Name, company, port, user manuals, external links, and mapped wireshark\namp modules and scripts).

Interface

Live

https://qeeqbox.github.io/ics-visualizer/

Features

  • ICS metadata (Name, company, port and info)
  • Mapped Wireshark and NMAP modules\scripts
  • External links to great ICS resources (Articles, manuals and projects)
  • Optimized canvas (Fast interaction)
  • Search function (Target item will be highlighted)
  • Zoom-in, zoom-out & reset options

Notes

  • ICS metadata db was compiled using my previous experience with ICS and a lot of great external articles\researches\projects (Do not forget to check them out!)

Resources

d3js.org wikipedia wireshark nmap and more

Other Licenses

By using this framework, you are accepting the license terms of each package listed below: D3, fontawesome, jQuery & JavaScript

Other Projects

Owner
QeeqBox
Security Projects for Red, Blue and Purple Teams
QeeqBox
Simple Python interface for Graphviz

Simple Python interface for Graphviz

Sebastian Bank 1.3k Dec 26, 2022
CPG represent!

CoolPandasGroup CPG represent! Arianna Brandon Enne Luan Tracie Project requirements: use Pandas to clean and format datasets use Jupyter Notebook to

Enne 3 Feb 07, 2022
JSNAPY example: Validate NAT policies

JSNAPY example: Validate NAT policies Overview This example will show how to use JSNAPy to make sure the expected NAT policy matches are taking place.

Calvin Remsburg 1 Jan 07, 2022
Handout for the tutorial "Creating publication-quality figures with matplotlib"

Handout for the tutorial "Creating publication-quality figures with matplotlib"

JB Mouret 1.9k Jan 02, 2023
Mattia Ficarelli 2 Mar 29, 2022
3D rendered visualization of the austrian monuments registry

Visualization of the Austrian Monuments Visualization of the monument landscape of the austrian monuments registry (Bundesdenkmalamt Denkmalverzeichni

Nikolai Janakiev 3 Oct 24, 2019
GitHubPoster - Make everything a GitHub svg poster

GitHubPoster Make everything a GitHub svg poster 支持 Strava 开心词场 扇贝 Nintendo Switch GPX 多邻国 Issue

yihong 1.3k Jan 02, 2023
Python script for writing text on github contribution chart.

Github Contribution Drawer Python script for writing text on github contribution chart. Requirements Python 3.X Getting Started Create repository Put

Steven 0 May 27, 2022
An adaptable Snakemake workflow which uses GATKs best practice recommendations to perform germline mutation calling starting with BAM files

Germline Mutation Calling This Snakemake workflow follows the GATK best-practice recommandations to call small germline variants. The pipeline require

12 Dec 24, 2022
High performance, editable, stylable datagrids in jupyter and jupyterlab

An ipywidgets wrapper of regular-table for Jupyter. Examples Two Billion Rows Notebook Click Events Notebook Edit Events Notebook Styling Notebook Pan

J.P. Morgan Chase 75 Dec 15, 2022
Dimensionality reduction in very large datasets using Siamese Networks

ivis Implementation of the ivis algorithm as described in the paper Structure-preserving visualisation of high dimensional single-cell datasets. Ivis

beringresearch 284 Jan 01, 2023
Fast data visualization and GUI tools for scientific / engineering applications

PyQtGraph A pure-Python graphics library for PyQt5/PyQt6/PySide2/PySide6 Copyright 2020 Luke Campagnola, University of North Carolina at Chapel Hill h

pyqtgraph 3.1k Jan 08, 2023
A set of three functions, useful in geographical calculations of different sorts

GreatCircle A set of three functions, useful in geographical calculations of different sorts. Available for PHP, Python, Javascript and Ruby. Live dem

72 Sep 30, 2022
Visualization of the World Religion Data dataset by Correlates of War Project.

World Religion Data Visualization Visualization of the World Religion Data dataset by Correlates of War Project. Mostly personal project to famirializ

Emile Bangma 1 Oct 15, 2022
Visualization of numerical optimization algorithms

Visualization of numerical optimization algorithms

Zhengxia Zou 46 Dec 01, 2022
Area-weighted venn-diagrams for Python/matplotlib

Venn diagram plotting routines for Python/Matplotlib Routines for plotting area-weighted two- and three-circle venn diagrams. Installation The simples

Konstantin Tretyakov 400 Dec 31, 2022
A Python package for caclulations and visualizations in geological sciences.

geo_calcs A Python package for caclulations and visualizations in geological sciences. Free software: MIT license Documentation: https://geo-calcs.rea

Drew Heasman 1 Jul 12, 2022
Python package for the analysis and visualisation of finite-difference fields.

discretisedfield Marijan Beg1,2, Martin Lang2, Samuel Holt3, Ryan A. Pepper4, Hans Fangohr2,5,6 1 Department of Earth Science and Engineering, Imperia

ubermag 12 Dec 14, 2022
This is a Web scraping project using BeautifulSoup and Python to scrape basic information of all the Test matches played till Jan 2022.

Scraping-test-matches-data This is a Web scraping project using BeautifulSoup and Python to scrape basic information of all the Test matches played ti

Souradeep Banerjee 4 Oct 10, 2022
This repository contains a streaming Dataflow pipeline written in Python with Apache Beam, reading data from PubSub.

Sample streaming Dataflow pipeline written in Python This repository contains a streaming Dataflow pipeline written in Python with Apache Beam, readin

Israel Herraiz 9 Mar 18, 2022