International Space Station data with Python research ๐ŸŒŽ

Related tags

Data AnalysisISS_data
Overview

espaciador

International Space Station data with Python research ๐ŸŒŽ

Plotting ISS trajectory, calculating the velocity over the earth and more.


Plotting trajectory:

We are going to make a graph of the trajectory of the ISS that is N minutes long. The N will be chosen by the user according to their preferences. This means that the program will run and keep points in a list for N minutes.
We will use an API to retrieve ISS current position in latitude and longitude:

http://open-notify.org/Open-Notify-API/ISS-Location-Now/

First we need to import the following python modules:

Pandas to read json data from ISS API, plotly to make the plot of the trajectory and time to time.sleep function
import pandas as pd
import plotly.express as px
import time

Second we must initialize the list that will preserve the latitude and longitude points (every sixty seconds). You also have to initialize the N variable with time in minutes

latitudes = []
longitudes = []
N = 60 # Sixty for one hour trajectory

Then we will create the following for loop to keep recording latitude-longitude points separated by one minute

We use for i in range(N), which is the time that the script will keep running (in hours) because we have a time.sleep(60) at the end
for i in range(N):  
    url = "http://api.open-notify.org/iss-now.json" # API URL

    df = pd.read_json(url) # Pandas read JSON data from API
    
    latitudes.append(df["iss_position"]["latitude"])  # We append latitude ISS position to latitudes list
    longitudes.append(df["iss_position"]["longitude"]) # We append longitude ISS position to longitudes list
    
    time.sleep(60) # This is used to separate de point records with one minute

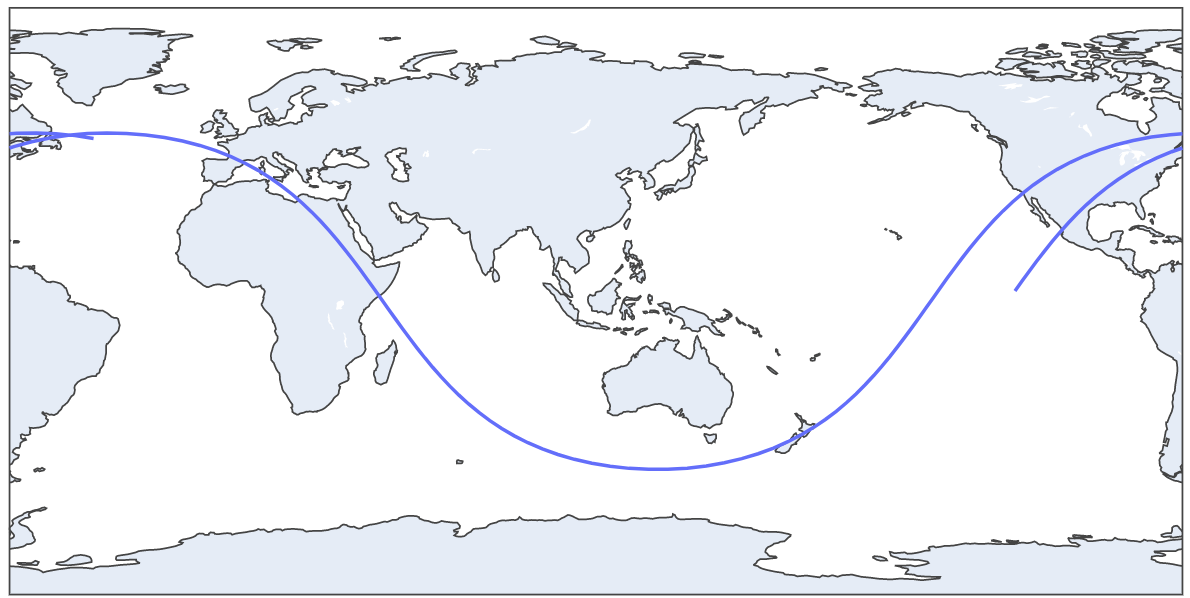
When the for loop finish the iterating we will have a record of N minutes ISS trajectory. Now we can plot this with Plotly (px.line_geo):

px.line_geo will create a plot with earth map
fig = px.line_geo(lat=latitudes, lon=longitudes) # Passing our latitudes and longitudes list as parameter
fig.show()  

image

This is a two hours trajectory plot

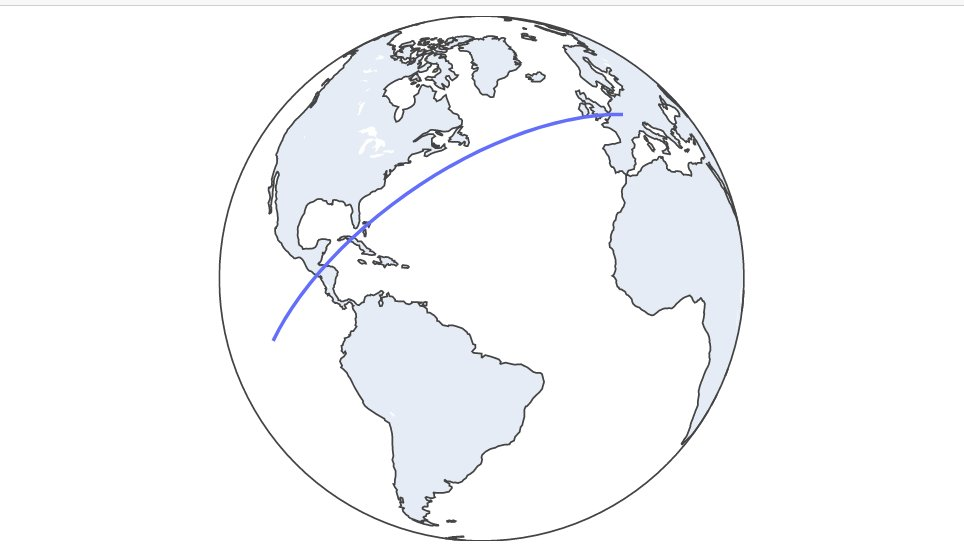
We can update our plot to orthographic projection with this code:

fig.update_geos(projection_type="orthographic")
fig.update_layout(height=300, margin={"r":0,"t":0,"l":0,"b":0})
fig.show()  

image

30 minutes trajectory plot

image

2 Hours trajectory plot GIF

Estimating ISS velocity:

We will estimate the ISS velocity using two diferent latitude-longitude points separated by one minute (sixty seconds). We can get the distance between that two points and then use phisics formula velocity(m/s) = distance(in meters)/time(in seconds)

First import the following python modules

import pandas as pd # Pandas to read API data
import time # Time for time.sleep
import geopy.distance # Geopy to get distance between two lat-lon points
import requests # Get another API data
import json # Read that data
We need to initialize two empty list to save latitudes and longitudes
lat = []
long = []
Next we will use a for loop to get the two latitude-longitude points separated by 60 seconds (time.sleep(60))
for i in range(2):  # for in range(2) because we want two lat-lon points

    url = "http://api.open-notify.org/iss-now.json" # API url

    df = pd.read_json(url) # Read API Json data with Pandas

    lat.append(df["iss_position"]["latitude"]) # Append latitude to lat list
    long.append(df["iss_position"]["longitude"]) # Append longitude to long list

    time.sleep(60) # Wait 60 seconds to record the second lat-lon point
When this for loop finish we will have a lat list with two latitude positions and one long list with two longitude positions. In conjuntion of this 4 numbers we have two lat-lon points in different time moments (separated by one minute)

Then we must get the distance between this points:

We create the two different points. The first one with lat[0] index and long[0]. The second one with lat[1] and long[0]
coords_1 = (lat[0], long[0]) 
coords_2 = (lat[1], long[1])
Then calculate distance with geopy library:
distance = (
geopy.distance.distance(coords_1, coords_2).m
) # Distance between the points in meters
But we must make a litle correction. Because ISS isn't moving in earth surface. It's orbiting aproximately 400Km above earth surface. So the radius is greater. The distance traveled is a litle bit more. To do this, we need to get ISS current altitud. Use the following code:

image

iss_alt_url = "https://api.wheretheiss.at/v1/satellites/25544"
r = requests.get(iss_alt_url)
r = r.text
r = json.loads(r)

iss_alt = int(r["altitude"]) # IN KM
Now apply phisics formula to make the correction
earth_radius = 6371 # in KM
distance_corrected = (distance * (earth_radius+iss_alt)/earth_radius)
Now finish the calculation with speed formula already explained:
speed = distancia_corrected/60 


print(round(speed*3.6, 3), "KM/H") # Multiplied by 3.6 to convert from m/s to km/h. Rounded by 3.

Output:

26367.118 KM/h
Owner
Facundo Pedaccio
Studying computer engineering and economics. I like computer science, physics, astrophysics, rocket science. Or rather the perfect combination of them.
Facundo Pedaccio
PyClustering is a Python, C++ data mining library.

pyclustering is a Python, C++ data mining library (clustering algorithm, oscillatory networks, neural networks). The library provides Python and C++ implementations (C++ pyclustering library) of each

Andrei Novikov 1k Jan 05, 2023
Tuplex is a parallel big data processing framework that runs data science pipelines written in Python at the speed of compiled code

Tuplex is a parallel big data processing framework that runs data science pipelines written in Python at the speed of compiled code. Tuplex has similar Python APIs to Apache Spark or Dask, but rather

Tuplex 791 Jan 04, 2023
This mini project showcase how to build and debug Apache Spark application using Python

Spark app can't be debugged using normal procedure. This mini project showcase how to build and debug Apache Spark application using Python programming language. There are also options to run Spark a

Denny Imanuel 1 Dec 29, 2021
Python implementation of Principal Component Analysis

Principal Component Analysis Principal Component Analysis (PCA) is a dimension-reduction algorithm. The idea is to use the singular value decompositio

Ignacio Darago 1 Nov 06, 2021
Snakemake workflow for converting FASTQ files to self-contained CRAM files with maximum lossless compression.

Snakemake workflow: name A Snakemake workflow for description Usage The usage of this workflow is described in the Snakemake Workflow Catalog. If

Algorithms for reproducible bioinformatics (Koesterlab) 1 Dec 16, 2021
Flexible HDF5 saving/loading and other data science tools from the University of Chicago

deepdish Flexible HDF5 saving/loading and other data science tools from the University of Chicago. This repository also host a Deep Learning blog: htt

UChicago - Department of Computer Science 255 Dec 10, 2022
Analyzing Covid-19 Outbreaks in Ontario

My group and I took Covid-19 outbreak statistics from ontario, and analyzed them to find different patterns and future predictions for the virus

Vishwaajeeth Kamalakkannan 0 Jan 20, 2022
Python package for analyzing behavioral data for Brain Observatory: Visual Behavior

Allen Institute Visual Behavior Analysis package This repository contains code for analyzing behavioral data from the Allen Brain Observatory: Visual

Allen Institute 16 Nov 04, 2022
Making the DAEN information accessible.

The purpose of this repository is to make the information on Australian COVID-19 adverse events accessible. The Therapeutics Goods Administration (TGA) keeps a database of adverse reactions to medica

10 May 10, 2022
Data imputations library to preprocess datasets with missing data

Impyute is a library of missing data imputation algorithms. This library was designed to be super lightweight, here's a sneak peak at what impyute can do.

Elton Law 329 Dec 05, 2022
For making Tagtog annotation into csv dataset

tagtog_relation_extraction for making Tagtog annotation into csv dataset How to Use On Tagtog 1. Go to Project Downloads 2. Download all documents,

hyeong 4 Dec 28, 2021
Exploratory Data Analysis for Employee Retention Dataset

Exploratory Data Analysis for Employee Retention Dataset Employee turn-over is a very costly problem for companies. The cost of replacing an employee

kana sudheer reddy 2 Oct 01, 2021
Open source platform for Data Science Management automation

Hydrosphere examples This repo contains demo scenarios and pre-trained models to show Hydrosphere capabilities. Data and artifacts management Some mod

hydrosphere.io 6 Aug 10, 2021
Utilize data analytics skills to solve real-world business problems using Humanaโ€™s big data

Humana-Mays-2021-HealthCare-Analytics-Case-Competition- The goal of the project is to utilize data analytics skills to solve real-world business probl

Yongxian (Caroline) Lun 1 Dec 27, 2021
This program analyzes a DNA sequence and outputs snippets of DNA that are likely to be protein-coding genes.

This program analyzes a DNA sequence and outputs snippets of DNA that are likely to be protein-coding genes.

1 Dec 28, 2021
A Python adaption of Augur to prioritize cell types in perturbation analysis.

A Python adaption of Augur to prioritize cell types in perturbation analysis.

Theis Lab 2 Mar 29, 2022
Project: Netflix Data Analysis and Visualization with Python

Project: Netflix Data Analysis and Visualization with Python Table of Contents General Info Installation Demo Usage and Main Functionalities Contribut

Kathrin Hรคlbich 2 Feb 13, 2022
Get mutations in cluster by querying from LAPIS API

Cluster Mutation Script Get mutations appearing within user-defined clusters. Usage Clusters are defined in the clusters dict in main.py: clusters = {

neherlab 1 Oct 22, 2021
Python for Data Analysis, 2nd Edition

Python for Data Analysis, 2nd Edition Materials and IPython notebooks for "Python for Data Analysis" by Wes McKinney, published by O'Reilly Media Buy

Wes McKinney 18.6k Jan 08, 2023