

Perspective is an interactive visualization component for large, real-time datasets. Originally developed for J.P. Morgan's trading business, Perspective makes it simple to build user-configurable analytics entirely in the browser, or in concert with Python and/or JupyterLab. Use it to create reports, dashboards, notebooks and applications, with static data or streaming updates via Apache Arrow.

Features
-
A fast, memory efficient streaming query engine, written in C++ and compiled for both WebAssembly and Python, with read/write/stream/virtual support for Apache Arrow.
-
A framework-agnostic User Interface component and Jupyterlab Widget, over WebWorker (WebAssembly) or WebSocket (Python/Node), and a suite of Datagrid and D3FC Chart plugins. `
Examples
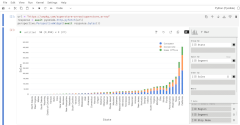
| Superstore | Olympics | Custom Styles |
 |
 |
 |
| Editable | Streaming | CSV |
 |
 |
 |
| IEX Cloud | NYC Citibike | JupyterLab Plugin |
 |
 |
 |

 18 Sep 11, 2022
 21 Dec 10, 2022
 3 Sep 10, 2022
 822 Jan 07, 2023
 6 Oct 19, 2021
 2.8k Dec 24, 2022
 23 Jan 03, 2023
 13 Oct 12, 2022
 11 Dec 05, 2022
 504 Dec 15, 2022
 335 Nov 29, 2022
 28 Dec 14, 2022
 2.7k Dec 30, 2022
 27.5k Dec 30, 2022
 4 Apr 04, 2022
 4 Dec 02, 2022
 1 Sep 01, 2022
 654 Jan 09, 2023
 1.9k Jan 02, 2023
 2 Dec 23, 2021