Colormaps for astronomers

Overview

cmastro: colormaps for astronomers 🔭

Documentation Status

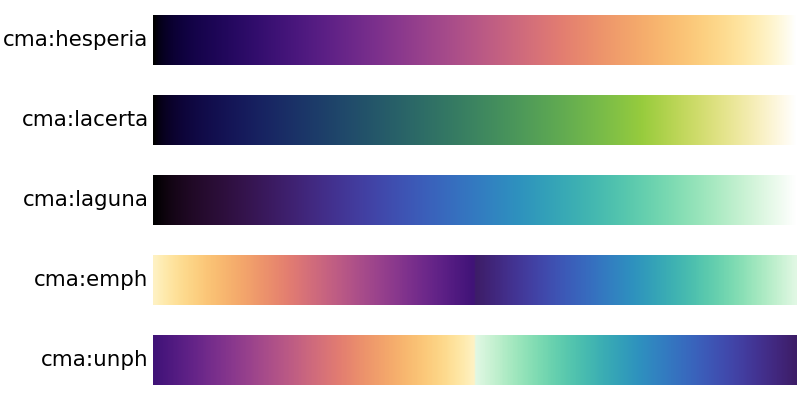
This package contains custom colormaps that have been used in various astronomical applications, similar to cmocean for oceanography. The colormaps are available as raw data files through the GitHub source repository, or available to use (through this Python package) as matplotlib colormaps.

cmaps

Also check out these other awesome colormap or color palette projects:

Installation

PyPI

cmastro is available via pip, which is the recommended installation method. To install the latest stable version using pip, use:

python -m pip install cmastro

To install the latest development version:

python -m pip install git+https://github.com/adrn/cmastro

License

License

cmastro is free software made available under the MIT License. For details see the LICENSE file. Copyright 2021 the contributors.

Owner
Adrian Price-Whelan
Adrian Price-Whelan
This is a sorting visualizer made with Tkinter.

Sorting-Visualizer This is a sorting visualizer made with Tkinter. Make sure you've installed tkinter in your system to use this visualizer pip instal

Vishal Choubey 7 Jul 06, 2022
Sparkling Pandas

SparklingPandas SparklingPandas aims to make it easy to use the distributed computing power of PySpark to scale your data analysis with Pandas. Sparkl

366 Oct 27, 2022
A Python-based non-fungible token (NFT) generator built using Samilla and Matplotlib

PyNFT A Pythonic NF (non-fungible token) generator built using Samilla and Matplotlib Use python pynft.py [amount] The intention behind this generato

Ayush Gundawar 6 Feb 07, 2022
Plot toolbox based on Matplotlib, simple and elegant.

Elegant-Plot Plot toolbox based on Matplotlib, simple and elegant. 绘制效果 绘制过程 数据准备 每种图标类型的目录下有data.csv文件,依据样例数据填入自己的数据。

3 Jul 15, 2022
Schema validation for Xarray objects

xarray-schema Schema validation for Xarray installation This package is in the early stages of development. Install it from source: pip install git+gi

carbonplan 22 Oct 31, 2022
Python package to visualize and cluster partial dependence.

partial_dependence A python library for plotting partial dependence patterns of machine learning classifiers. The technique is a black box approach to

NYU Visualization Lab 25 Nov 14, 2022
Minimal Ethereum fee data viewer for the terminal, contained in a single python script.

Minimal Ethereum fee data viewer for the terminal, contained in a single python script. Connects to your node and displays some metrics in real-time.

48 Dec 05, 2022
This is simply repo for line drawing rendering using freestyle in Blender.

blender_freestyle_line_drawing This is simply repo for line drawing rendering using freestyle in Blender. how to use blender2935 --background --python

MaxLin 3 Jul 02, 2022
This is a Web scraping project using BeautifulSoup and Python to scrape basic information of all the Test matches played till Jan 2022.

Scraping-test-matches-data This is a Web scraping project using BeautifulSoup and Python to scrape basic information of all the Test matches played ti

Souradeep Banerjee 4 Oct 10, 2022
HW 2: Visualizing interesting datasets

HW 2: Visualizing interesting datasets Check out the project instructions here! Mean Earnings per Hour for Males and Females My first graph uses data

7 Oct 27, 2021
Ana's Portfolio

Ana's Portfolio ✌️ Welcome to my Portfolio! You will find here different Projects I have worked on (from scratch) 💪 Projects 💻 1️⃣ Hangman game (Mad

Ana Katherine Cortes Sobrino 9 Mar 15, 2022
Data visualization electromagnetic spectrum

Datenvisualisierung-Elektromagnetischen-Spektrum Anhand des Moduls matplotlib sollen die Daten des elektromagnetischen Spektrums dargestellt werden. D

Pulsar 1 Sep 01, 2022
Flexitext is a Python library that makes it easier to draw text with multiple styles in Matplotlib

Flexitext is a Python library that makes it easier to draw text with multiple styles in Matplotlib

Tomás Capretto 93 Dec 28, 2022
`charts.css.py` brings `charts.css` to Python. Online documentation and samples is available at the link below.

charts.css.py charts.css.py provides a python API to convert your 2-dimension data lists into html snippet, which will be rendered into charts by CSS,

Ray Luo 3 Sep 23, 2021
NumPy and Pandas interface to Big Data

Blaze translates a subset of modified NumPy and Pandas-like syntax to databases and other computing systems. Blaze allows Python users a familiar inte

Blaze 3.1k Jan 01, 2023
Visualizations for machine learning datasets

Introduction The facets project contains two visualizations for understanding and analyzing machine learning datasets: Facets Overview and Facets Dive

PAIR code 7.1k Jan 07, 2023
Realtime Web Apps and Dashboards for Python and R

H2O Wave Realtime Web Apps and Dashboards for Python and R New! R Language API Build and control Wave dashboards using R! New! Easily integrate AI/ML

H2O.ai 3.4k Jan 06, 2023
Render Jupyter notebook in the terminal

jut - JUpyter notebook Terminal viewer. The command line tool view the IPython/Jupyter notebook in the terminal. Install pip install jut Usage $jut --

Kracekumar 169 Dec 27, 2022
A curated list of awesome Dash (plotly) resources

Awesome Dash A curated list of awesome Dash (plotly) resources Dash is a productive Python framework for building web applications. Written on top of

Luke Singham 1.7k Dec 26, 2022