Render Jupyter notebook in the terminal

Overview

jut - JUpyter notebook Terminal viewer.

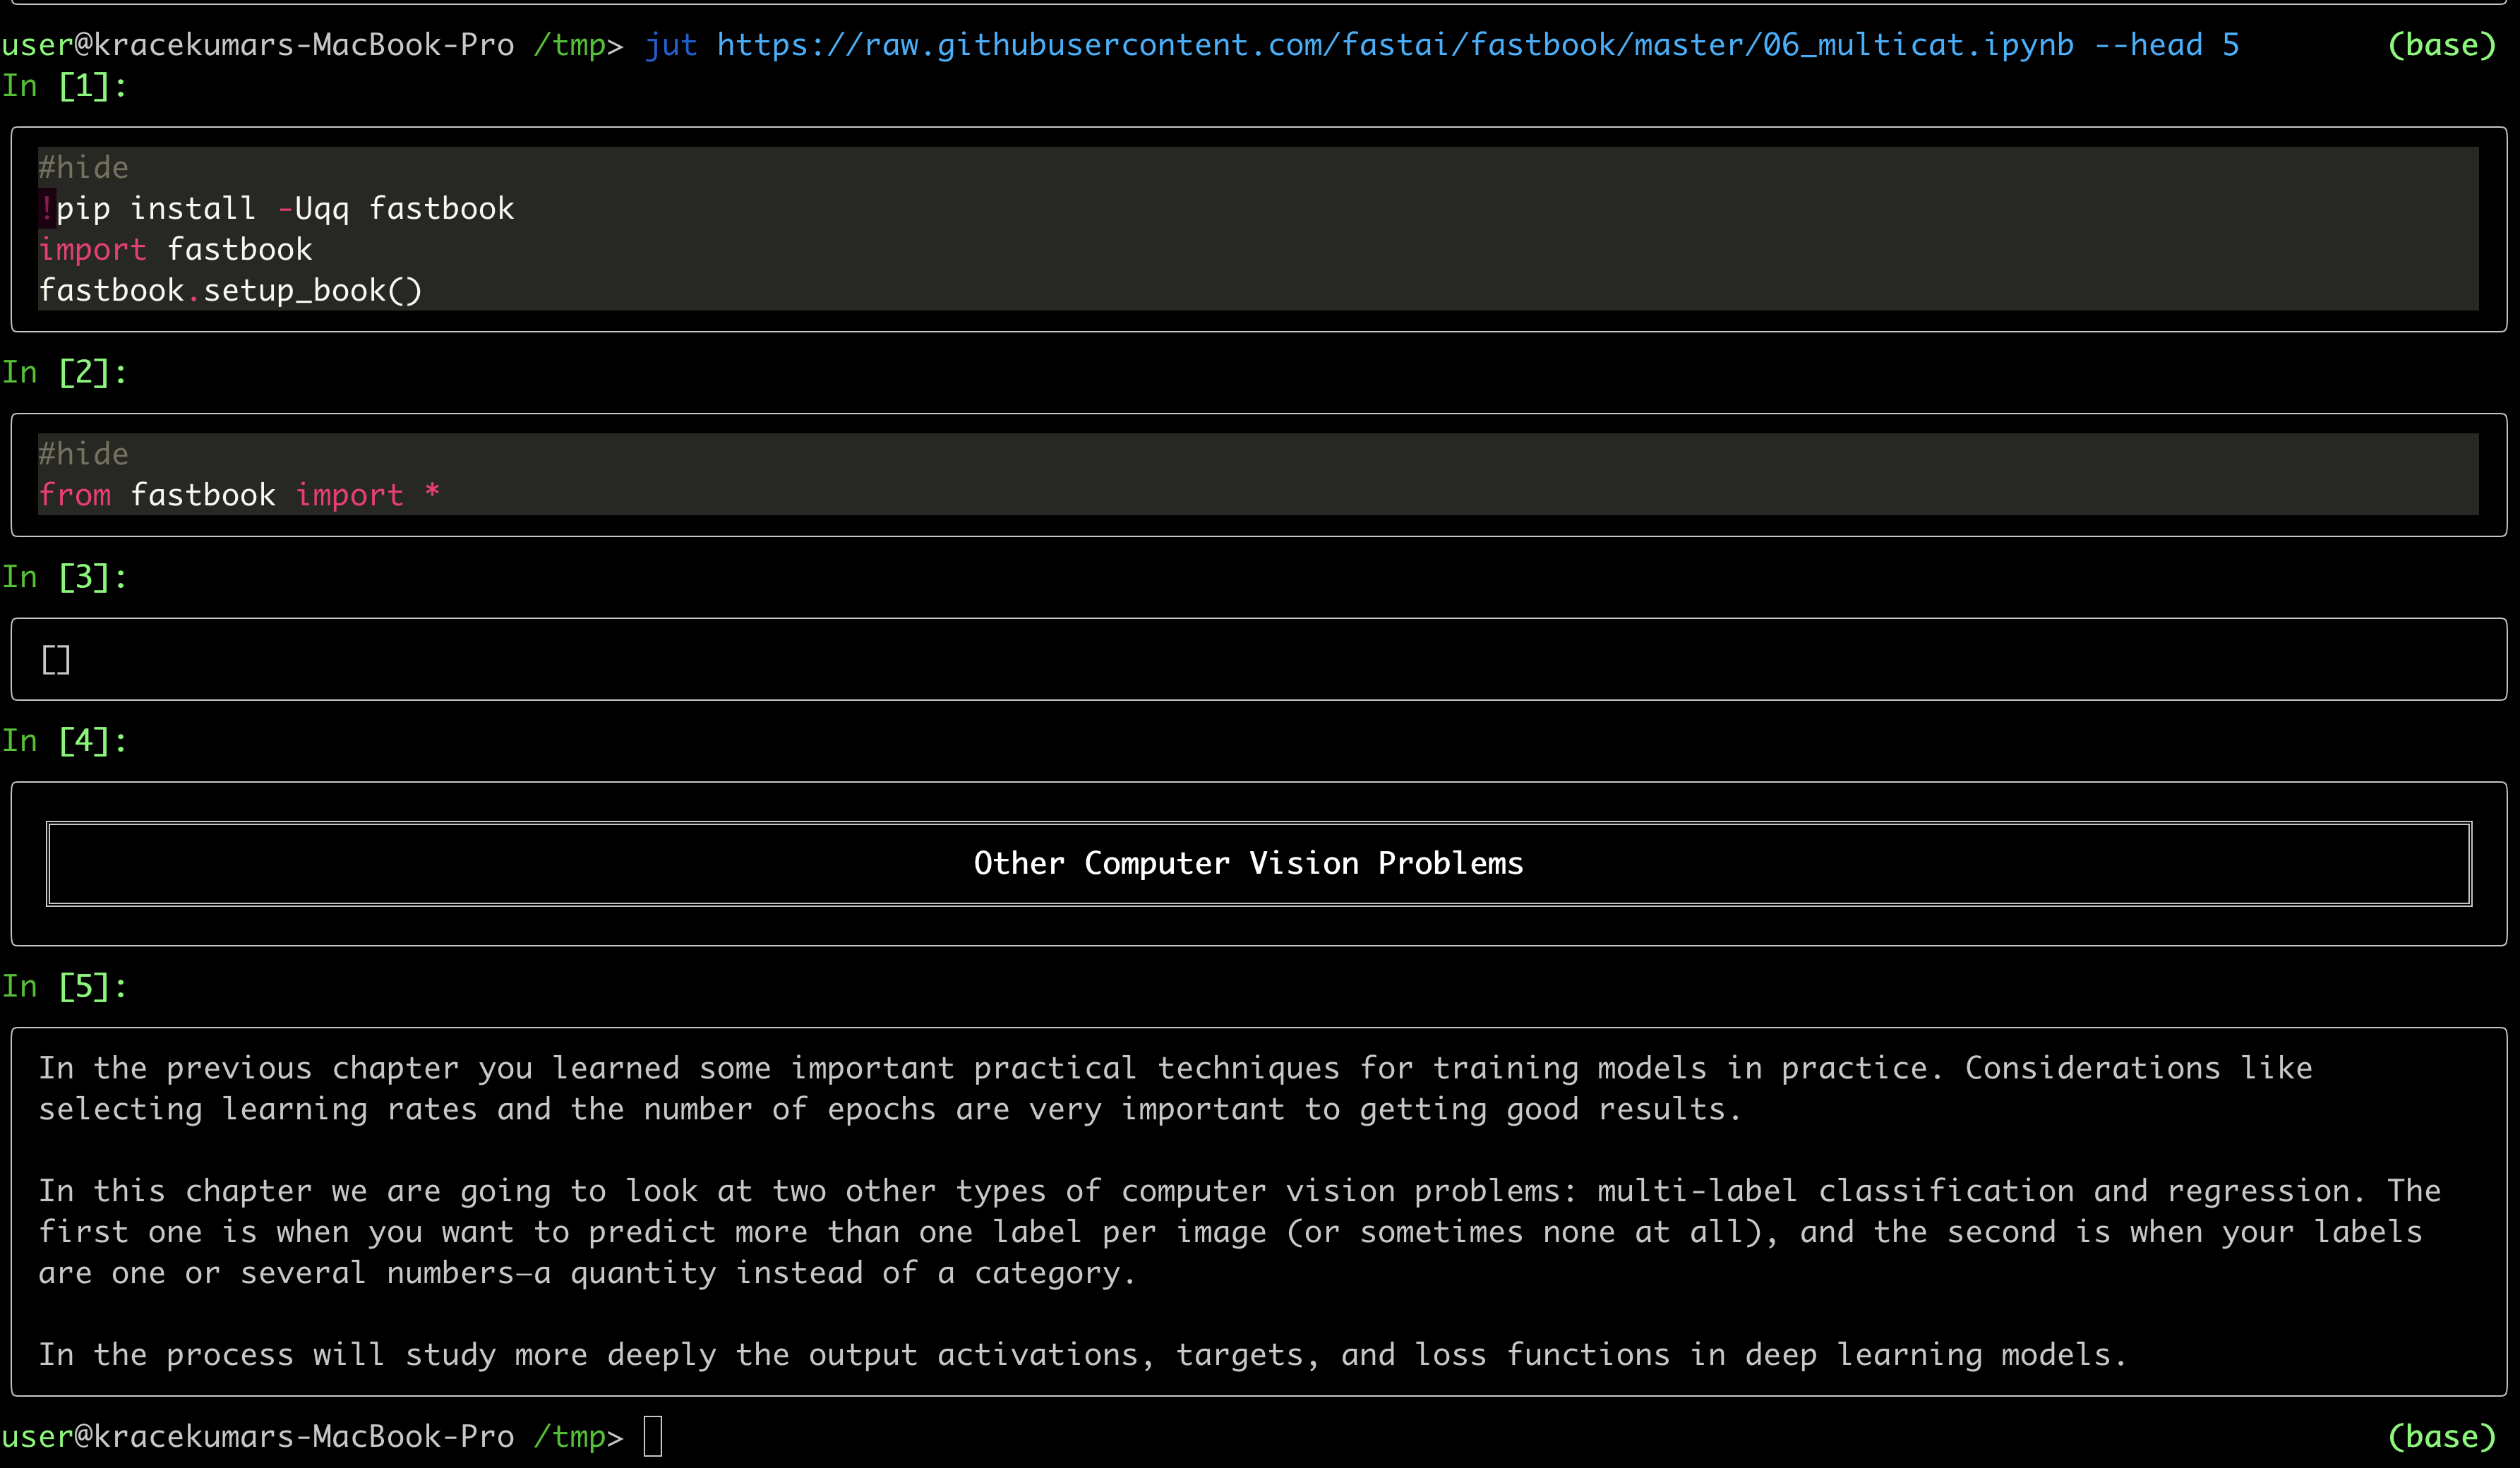
The command line tool view the IPython/Jupyter notebook in the terminal.

Install

pip install jut

Usage

$jut --help
Usage: jut [OPTIONS]

Options:
  -u, --url TEXT             Render the ipynb file from the URL
  -i, --input-file FILENAME  File from the local file-system
  -h, --head INTEGER         Display first n cells. Default is 10
  -t, --tail INTEGER         Display last n cells
  -p, --single-page          Should the result be in a single page?
  -f, --full-display         Should all the contents in the file displayed?
  --help                     Show this message and exit.
ASCIICinema Demo

asciicast

Display first five cells

jut-head-example

Display last five cells

jut-tail-example

Download the file and display first five cells

jut-download-url

Owner
Kracekumar
Server side guy specializing in Python. I am interested in back-end technologies, machine learning, automation, systems and performance.
Kracekumar
This is Pygrr PolyArt, a program used for drawing custom Polygon models for your Pygrr project!

This is Pygrr PolyArt, a program used for drawing custom Polygon models for your Pygrr project!

Isaac 4 Dec 14, 2021
China and India Population and GDP Visualization

China and India Population and GDP Visualization Historical Population Comparison between India and China This graph shows the population data of Indi

Nicolas De Mello 10 Oct 27, 2021
Simulation du problème de Monty Hall avec Python et matplotlib

Le problème de Monty Hall C'est un jeu télévisé où il y a trois portes sur le plateau de jeu. Seule une de ces portes cache un trésor. Il n'y a rien d

ETCHART YANG 1 Jan 06, 2022
🗾 Streamlit Component for rendering kepler.gl maps

streamlit-keplergl 🗾 Streamlit Component for rendering kepler.gl maps in a streamlit app. 🎈 Live Demo 🎈 Installation pip install streamlit-keplergl

Christoph Rieke 39 Dec 14, 2022
Visualize the bitcoin blockchain from your local node

Project Overview A new feature in Bitcoin Core 0.20 allows users to dump the state of the blockchain (the UTXO set) using the command dumptxoutset. I'

18 Sep 11, 2022
🎨 Python3 binding for `@AntV/G2Plot` Plotting Library .

PyG2Plot 🎨 Python3 binding for @AntV/G2Plot which an interactive and responsive charting library. Based on the grammar of graphics, you can easily ma

hustcc 990 Jan 05, 2023
Sparkling Pandas

SparklingPandas SparklingPandas aims to make it easy to use the distributed computing power of PySpark to scale your data analysis with Pandas. Sparkl

366 Oct 27, 2022
Dimensionality reduction in very large datasets using Siamese Networks

ivis Implementation of the ivis algorithm as described in the paper Structure-preserving visualisation of high dimensional single-cell datasets. Ivis

beringresearch 284 Jan 01, 2023
100 data puzzles for pandas, ranging from short and simple to super tricky (60% complete)

100 pandas puzzles Puzzles notebook Solutions notebook Inspired by 100 Numpy exerises, here are 100* short puzzles for testing your knowledge of panda

Alex Riley 1.9k Jan 08, 2023
A python package for animating plots build on matplotlib.

animatplot A python package for making interactive as well as animated plots with matplotlib. Requires Python = 3.5 Matplotlib = 2.2 (because slider

Tyler Makaro 394 Dec 18, 2022
Visualization Library

CamViz Overview // Installation // Demos // License Overview CamViz is a visualization library developed by the TRI-ML team with the goal of providing

Toyota Research Institute - Machine Learning 67 Nov 24, 2022
Simple plotting for Python. Python wrapper for D3xter - render charts in the browser with simple Python syntax.

PyDexter Simple plotting for Python. Python wrapper for D3xter - render charts in the browser with simple Python syntax. Setup $ pip install PyDexter

D3xter 31 Mar 06, 2021
Bioinformatics tool for exploring RNA-Protein interactions

Explore RNA-Protein interactions. RNPFind is a bioinformatics tool. It takes an RNA transcript as input and gives a list of RNA binding protein (RBP)

Nahin Khan 3 Jan 27, 2022
:small_red_triangle: Ternary plotting library for python with matplotlib

python-ternary This is a plotting library for use with matplotlib to make ternary plots plots in the two dimensional simplex projected onto a two dime

Marc 611 Dec 29, 2022
A high-level plotting API for pandas, dask, xarray, and networkx built on HoloViews

hvPlot A high-level plotting API for the PyData ecosystem built on HoloViews. Build Status Coverage Latest dev release Latest release Docs What is it?

HoloViz 694 Jan 04, 2023
Visualize your pandas data with one-line code

PandasEcharts 简介 基于pandas和pyecharts的可视化工具 安装 pip 安装 $ pip install pandasecharts 源码安装 $ git clone https://github.com/gamersover/pandasecharts $ cd pand

陈华杰 2 Apr 13, 2022
Library for exploring and validating machine learning data

TensorFlow Data Validation TensorFlow Data Validation (TFDV) is a library for exploring and validating machine learning data. It is designed to be hig

688 Jan 03, 2023
A little word cloud generator in Python

Linux macOS Windows PyPI word_cloud A little word cloud generator in Python. Read more about it on the blog post or the website. The code is tested ag

Andreas Mueller 9.2k Dec 30, 2022
Pretty Confusion Matrix

Pretty Confusion Matrix Why pretty confusion matrix? We can make confusion matrix by using matplotlib. However it is not so pretty. I want to make con

Junseo Ko 5 Nov 22, 2022
A shimmer pre-load component for Plotly Dash

dash-loading-shimmer A shimmer pre-load component for Plotly Dash Installation Get it with pip: pip install dash-loading-extras Or maybe you prefer Pi

Lucas Durand 4 Oct 12, 2022