PyPassword is a simple follow up to PyPassphrase

Overview

PyPassword

PyPassword is a simple follow up to PyPassphrase. After finishing that project it occured to me that while some may wish to use that option, may not be able to do so due to pre-defined password requirements (for example, spaces not allowed or an arbitrary limit on the number of characters). Therefore, it seemed reasonable to create a more traditional password generator but wrap it also in a GUI frontend with PySimpleGUI.

There is nothing particularly special about this application past its compliment to PyPassphrase. In fact, I will likely merge the two applications so that both options exist in one.

Stay Tuned!

In the meantime, if you choose to use this as a stand-alone password generator keep in mind no attempts are made to make the resulting passwords easier to remember and it is highly recommended that you use a trusted and secure password manager such as Keepass or Linux Pass to store and manage the passwords.

The passwords are generated using the Python string library using lowercase, uppercase, digits and punctuation characters. Which group is used is chosen at random using the Python secrets library. A loop is used to randomize the list of characters and then from that list a random sample is taken that is the length of the password specified.

The result is some truly cyrptic passwords that, if using sufficient length (generally 15 characters or more), will be strong enough for most applications.

Currently only the command line option exists to launch the application and that for only Linux at the moment. To use the application simply download the binary and from the location where it is saved launch a terminal session and run the command ./pypassword. This will launch the GUI frontend.

Screenshots

You might also like...
A simple script that displays pixel-based animation on GitHub Activity

GitHub Activity Animator This project contains a simple Javascript snippet that produces an animation on your GitHub activity tracker. The project als

A simple python tool for explore your object detection dataset

A simple tool for explore your object detection dataset. The goal of this library is to provide simple and intuitive visualizations from your dataset and automatically find the best parameters for generating a specific grid of anchors that can fit you data characteristics

A deceptively simple plotting library for Streamlit

🍅 Plost A deceptively simple plotting library for Streamlit. Because you've been writing plots wrong all this time. Getting started pip install plost

Simple spectra visualization tool for astronomers

SpecViewer A simple visualization tool for astronomers. Dependencies Python = 3.7.4 PyQt5 = 5.15.4 pyqtgraph == 0.10.0 numpy = 1.19.4 How to use py

Simple CLI python app to show a stocks graph performance. Made with Matplotlib and Tiingo.

stock-graph-python Simple CLI python app to show a stocks graph performance. Made with Matplotlib and Tiingo. Tiingo API Key You will need to add your

Simple Inkscape Scripting

Simple Inkscape Scripting Description In the Inkscape vector-drawing program, how would you go about drawing 100 diamonds, each with a random color an

eoplatform is a Python package that aims to simplify Remote Sensing Earth Observation by providing actionable information on a wide swath of RS platforms and provide a simple API for downloading and visualizing RS imagery

An Earth Observation Platform Earth Observation made easy. Report Bug | Request Feature About eoplatform is a Python package that aims to simplify Rem

simple tool to paint axis x and y

simple tool to paint axis x and y

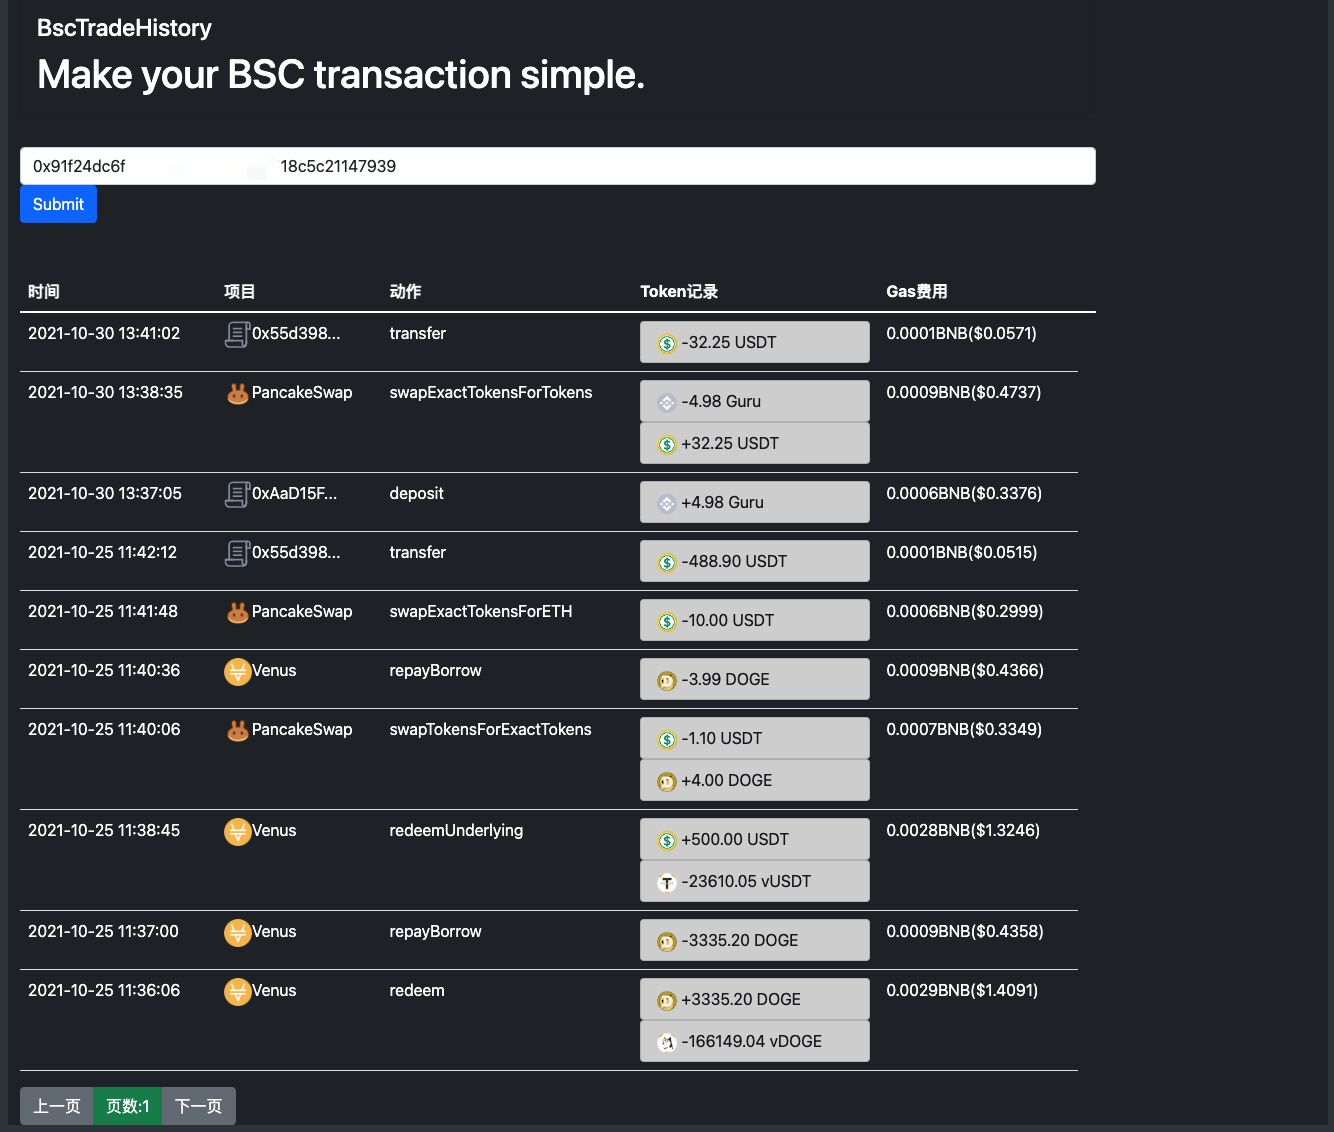
Make your BSC transaction simple.

bsc_trade_history Make your BSC transaction simple. 中文ReadMe Background: inspired by debank ,Practice my hands on this small project Blog:Crypto-BscTr

Comments
Releases(v1.1.0)
Owner
Scotty
Scotty
A concise grammar of interactive graphics, built on Vega.

Vega-Lite Vega-Lite provides a higher-level grammar for visual analysis that generates complete Vega specifications. You can find more details, docume

Vega 4k Jan 08, 2023
Here I plotted data for the average test scores across schools and class sizes across school districts.

HW_02 Here I plotted data for the average test scores across schools and class sizes across school districts. Average Test Score by Race This graph re

7 Oct 27, 2021
python partial dependence plot toolbox

PDPbox python partial dependence plot toolbox Motivation This repository is inspired by ICEbox. The goal is to visualize the impact of certain feature

Li Jiangchun 723 Jan 07, 2023
Joyplots in Python with matplotlib & pandas :chart_with_upwards_trend:

JoyPy JoyPy is a one-function Python package based on matplotlib + pandas with a single purpose: drawing joyplots (a.k.a. ridgeline plots). The code f

Leonardo Taccari 462 Jan 02, 2023
🌀❄️🌩️ This repository contains some examples for creating 2d and 3d weather plots using matplotlib and cartopy libraries in python3.

Weather-Plotting 🌀 ❄️ 🌩️ This repository contains some examples for creating 2d and 3d weather plots using matplotlib and cartopy libraries in pytho

Giannis Dravilas 21 Dec 10, 2022
:small_red_triangle: Ternary plotting library for python with matplotlib

python-ternary This is a plotting library for use with matplotlib to make ternary plots plots in the two dimensional simplex projected onto a two dime

Marc 611 Dec 29, 2022
SummVis is an interactive visualization tool for text summarization.

SummVis is an interactive visualization tool for analyzing abstractive summarization model outputs and datasets.

Robustness Gym 246 Dec 08, 2022
Data Visualizations for the #30DayChartChallenge

The #30DayChartChallenge This repository contains all the charts made for the #30DayChartChallenge during the month of April. This project aims to exp

Isaac Arroyo 7 Sep 20, 2022
The Metabolomics Integrator (MINT) is a post-processing tool for liquid chromatography-mass spectrometry (LCMS) based metabolomics.

MINT (Metabolomics Integrator) The Metabolomics Integrator (MINT) is a post-processing tool for liquid chromatography-mass spectrometry (LCMS) based m

Sören Wacker 0 May 04, 2022
Example scripts for generating plots of Bohemian matrices

Bohemian Eigenvalue Plotting Examples This repository contains examples of generating plots of Bohemian eigenvalues. The examples in this repository a

Bohemian Matrices 5 Nov 12, 2022
A tool for creating Toontown-style nametags in Panda3D

Toontown-Nametag Toontown-Nametag is a tool for creating Toontown Online/Toontown Rewritten-style nametags in Panda3D. It contains a function, createN

BoggoTV 2 Dec 23, 2021
Calendar heatmaps from Pandas time series data

Note: See MarvinT/calmap for the maintained version of the project. That is also the version that gets published to PyPI and it has received several f

Martijn Vermaat 195 Dec 22, 2022
Squidpy is a tool for the analysis and visualization of spatial molecular data.

Squidpy is a tool for the analysis and visualization of spatial molecular data. It builds on top of scanpy and anndata, from which it inherits modularity and scalability. It provides analysis tools t

Theis Lab 251 Dec 19, 2022
Extensible, parallel implementations of t-SNE

openTSNE openTSNE is a modular Python implementation of t-Distributed Stochasitc Neighbor Embedding (t-SNE) [1], a popular dimensionality-reduction al

Pavlin Poličar 1.1k Jan 03, 2023
A python wrapper for creating and viewing effects for Matt Parker's christmas tree.

Christmas Tree Visualizer A python wrapper for creating and viewing effects for Matt Parker's christmas tree. Displays py or csv effect files and allo

4 Nov 22, 2022
Automatic data visualization in atom with the nteract data-explorer

Data Explorer Interactively explore your data directly in atom with hydrogen! The nteract data-explorer provides automatic data visualization, so you

Ben Russert 65 Dec 01, 2022
✅ Today I Learn

Today I Learn EDA numpy_100ex numpy_0~10 airline_satisfaction_prediction BERT_naver_movie_classification NLP_prepare NLP_Tweet_Emotion_Recognition tex

Yeonghoo_Ahn 3 Dec 15, 2022
Political elections, appointment, analysis and visualization in Python

Political elections, appointment, analysis and visualization in Python poli-sci-kit is a Python package for political science appointment and election

Andrew Tavis McAllister 9 Dec 01, 2022
Tandem Mass Spectrum Prediction with Graph Transformers

MassFormer This is the original implementation of MassFormer, a graph transformer for small molecule MS/MS prediction. Check out the preprint on arxiv

Röst Lab 13 Oct 27, 2022
An open-source tool for visual and modular block programing in python

PyFlow PyFlow is an open-source tool for modular visual programing in python ! Although for now the tool is in Beta and features are coming in bit by

1.1k Jan 06, 2023