Jupyter Notebook extension leveraging pandas DataFrames by integrating DataTables and ChartJS.

Overview

Jupyter DataTables

Jupyter Notebook extension to leverage pandas DataFrames by integrating DataTables JS.


About

Data scientists and in fact many developers work with pd.DataFrame on daily basis to interpret data to process them. In my typical workflow. The common workflow is to display the dataframe, take a look at the data schema and then produce multiple plots to check the distribution of the data to have a clearer picture, perhaps search some data in the table, etc...

What if those distribution plots were part of the standard DataFrame and we had the ability to quickly search through the table with minimal effort? What if it was the default representation?

The jupyter-datatables uses jupyter-require to draw the table.


Installation

pip install jupyter-datatables

Usage

import numpy as np
import pandas as pd

from jupyter_datatables import init_datatables_mode

init_datatables_mode()

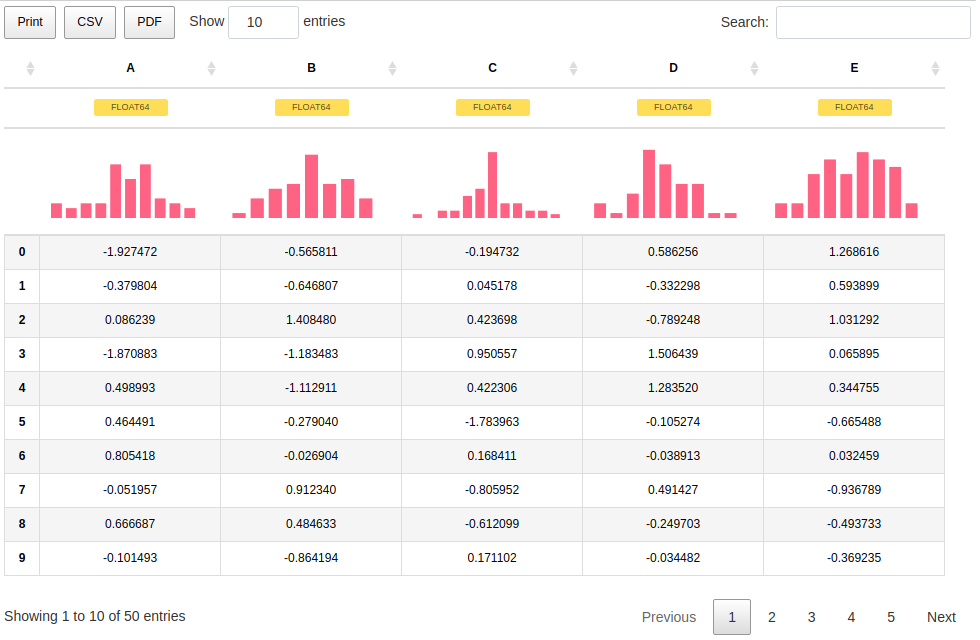
That's it, your default pandas representation will now use Jupyter DataTables!

df = pd.DataFrame(np.abs(np.random.randn(50, 5)), columns=list(string.ascii_uppercase[:5]))

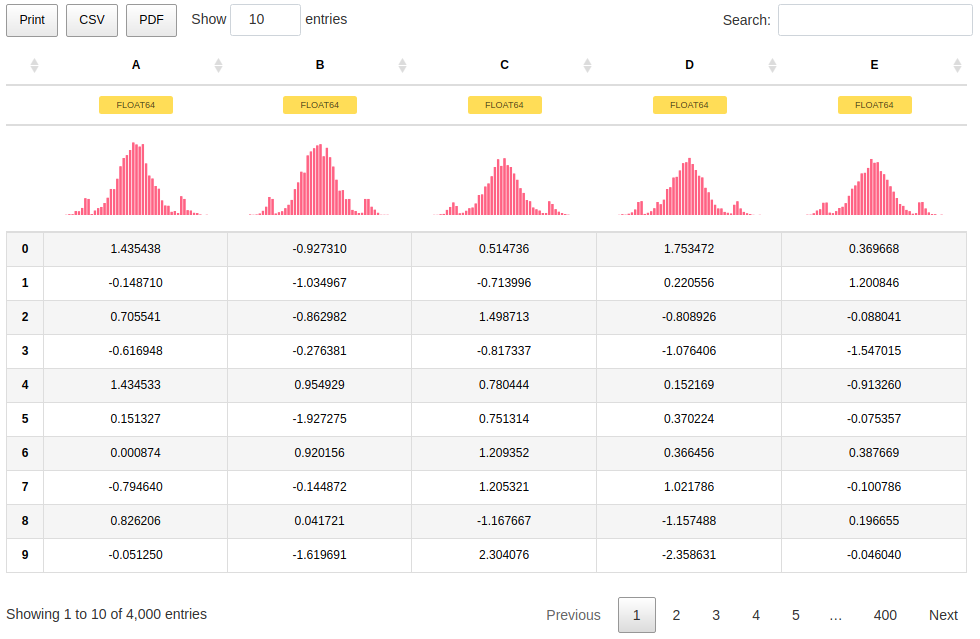
Jupyter Datatables table representation


In most cases, you don't need to worry too much about the size of your data. Jupyter DataTables calculates required sample size based on a confidence interval (by default this would be 0.95) and margin of error and ceils it to the highest 'smart' value.

For example, for a data containing 100,000 samples, given 0.975 confidence interval and 0.02 margin of error, the Jupyter DataTables would calculate that 3044 samples are required and it would round it up to 4000.

Jupyter Datatables long table sample size

With additional note:

Sample size: 4,000 out of 100,000


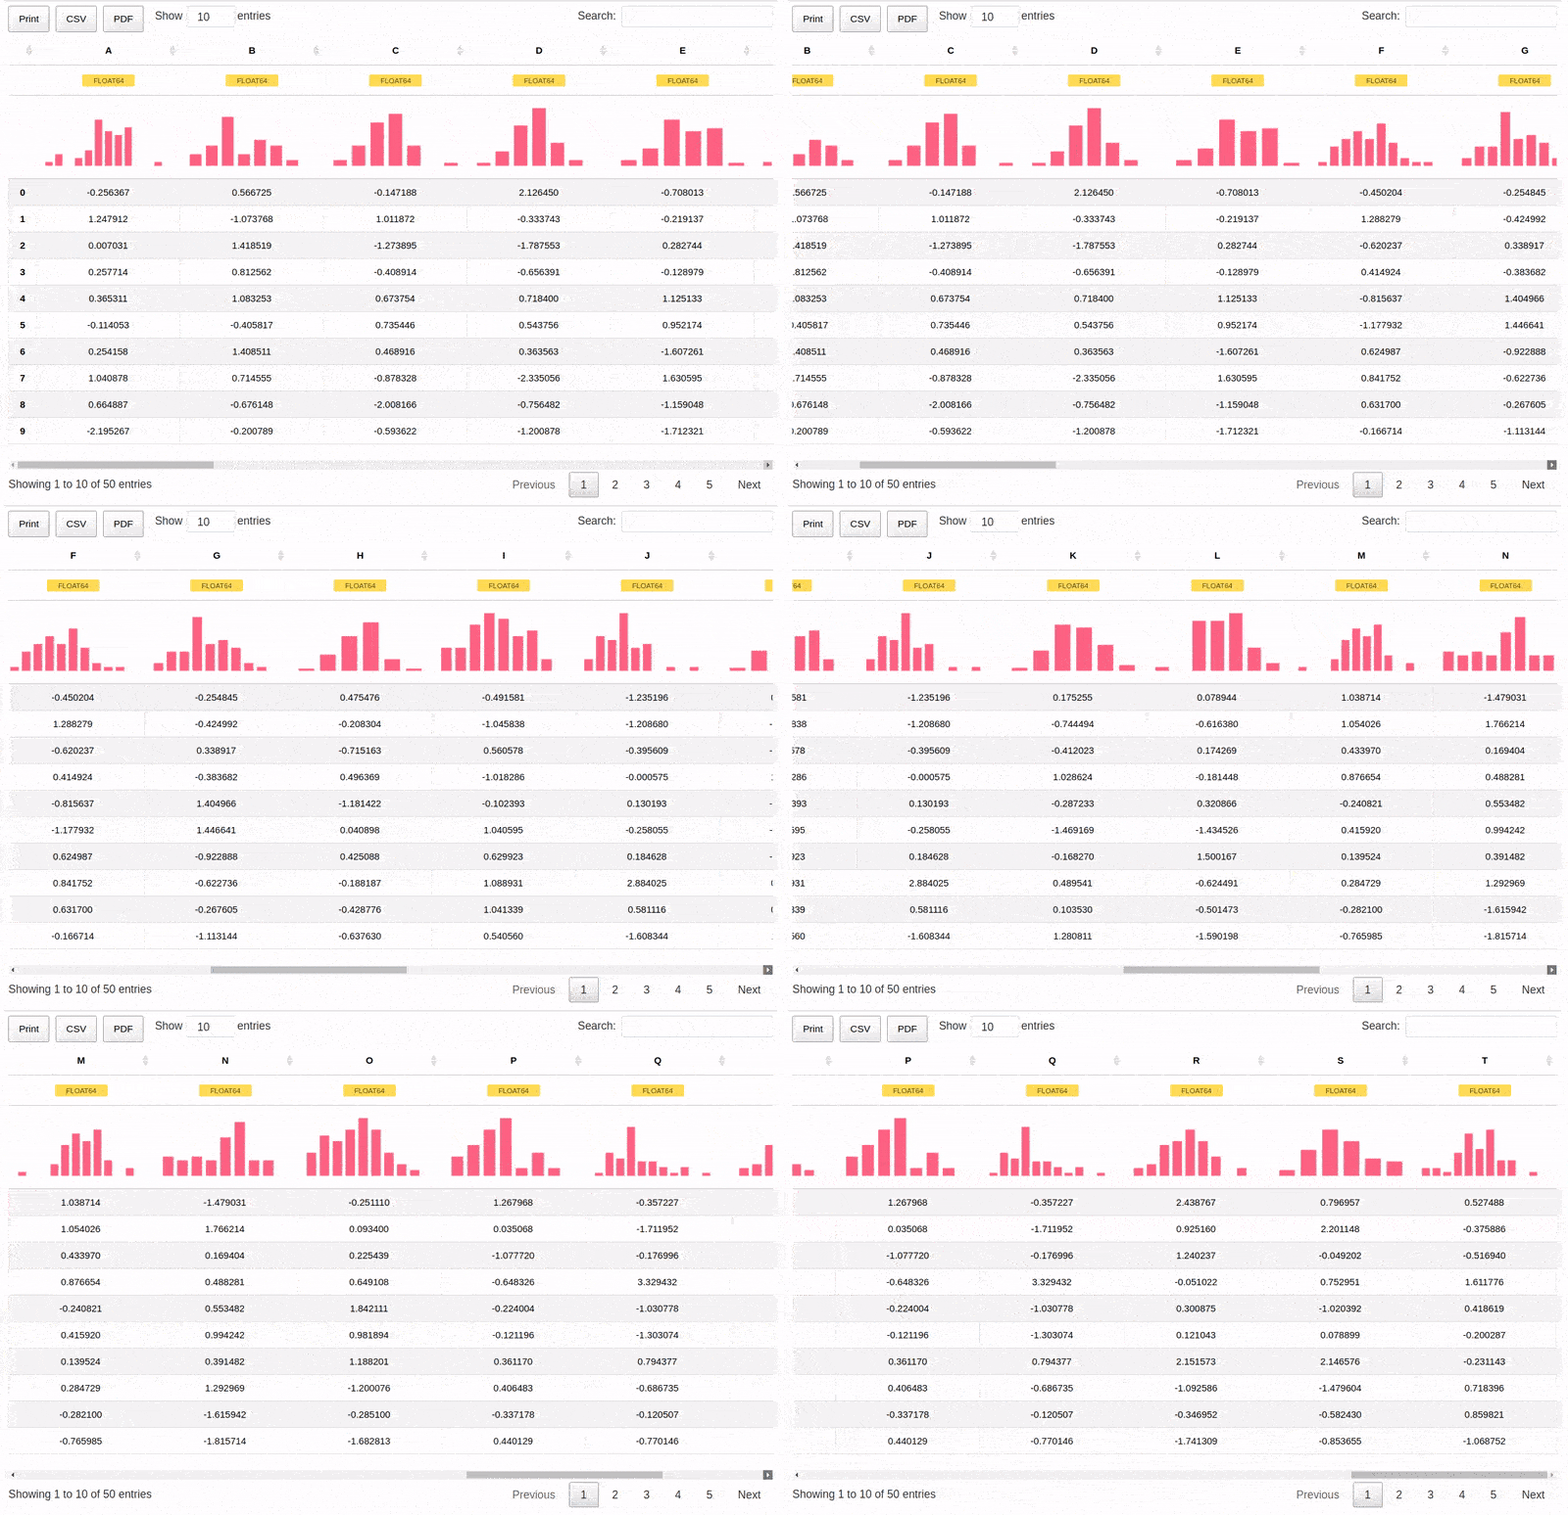
We can also handle wide tables with ease.

df = pd.DataFrame(np.abs(np.random.randn(50, 20)), columns=list(string.ascii_uppercase[:20]))

Jupyter Datatables wide table representation


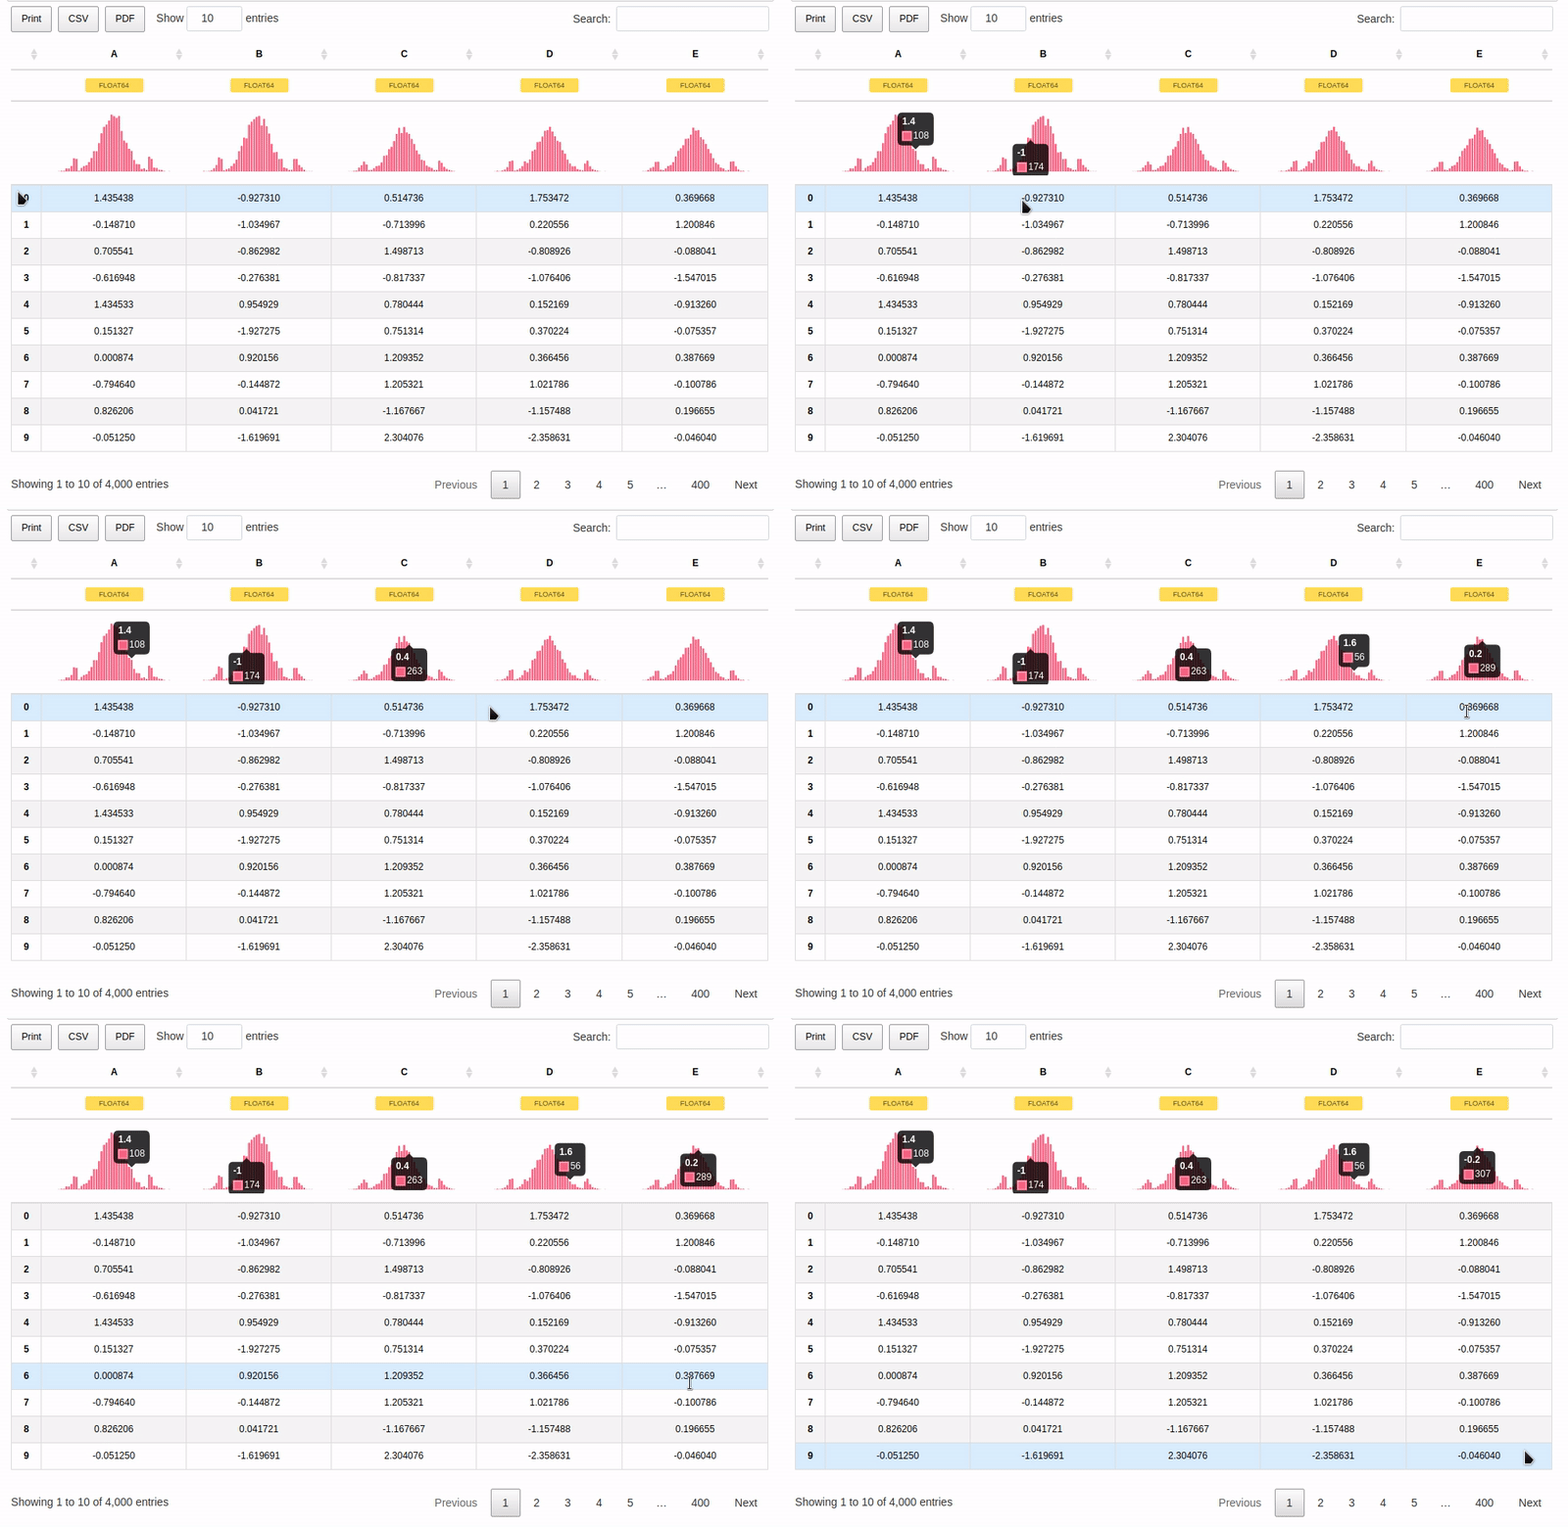
As per 0.3.0, there is a support for interactive tooltips:

Jupyter Datatables wide table representation

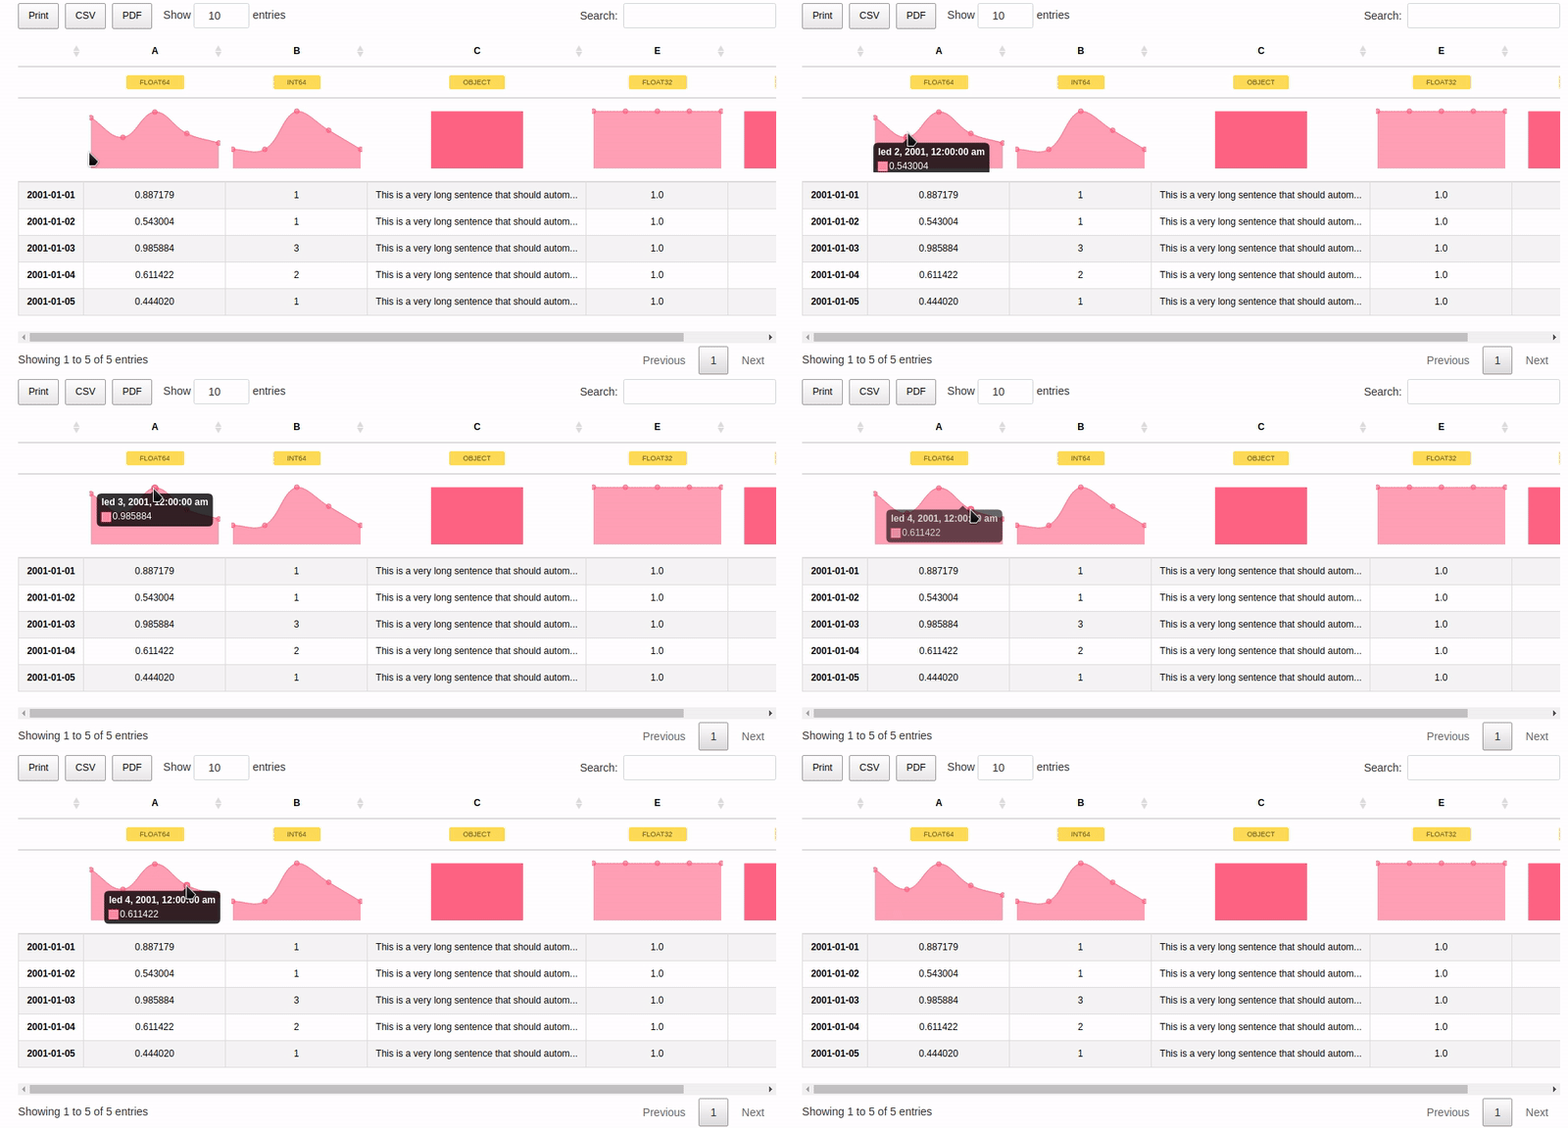
And also support for custom indices including Date type:

dft = pd.DataFrame({'A': np.random.rand(5),
                    'B': [1, 1, 3, 2, 1],
                    'C': 'This is a very long sentence that should automatically be trimmed',
                    'D': [pd.Timestamp('20010101'), pd.Timestamp('20010102'), pd.Timestamp('20010103'), pd.Timestamp('20010104'), pd.Timestamp('20010105')],
                    'E': pd.Series([1.0] * 5).astype('float32'),
                    'F': [False, True, False, False, True],
                   })

dft.D = dft.D.apply(pd.to_datetime)
dft.set_index('D', inplace=True)

Jupyter Datatables wide table representation


Current status and future plans:

Check out the Project Board where we track issues and TODOs for our Jupyter tooling!


Author: Marek Cermak [email protected], @AICoE
Owner
Marek Čermák
DevOps Engineer @ LivesportTV
Marek Čermák
Declarative statistical visualization library for Python

Altair http://altair-viz.github.io Altair is a declarative statistical visualization library for Python. With Altair, you can spend more time understa

Altair 8k Jan 05, 2023
Datapane is the easiest way to create data science reports from Python.

Datapane Teams | Documentation | API Docs | Changelog | Twitter | Blog Share interactive plots and data in 3 lines of Python. Datapane is a Python lib

Datapane 744 Jan 06, 2023
NumPy and Pandas interface to Big Data

Blaze translates a subset of modified NumPy and Pandas-like syntax to databases and other computing systems. Blaze allows Python users a familiar inte

Blaze 3.1k Jan 01, 2023
A Python library for plotting hockey rinks with Matplotlib.

Hockey Rink A Python library for plotting hockey rinks with Matplotlib. Installation pip install hockey_rink Current Rinks The following shows the cus

24 Jan 02, 2023
Simple python implementation with matplotlib to manually fit MIST isochrones to Gaia DR2 color-magnitude diagrams

Simple python implementation with matplotlib to manually fit MIST isochrones to Gaia DR2 color-magnitude diagrams

Karl Jaehnig 7 Oct 22, 2022
A Bokeh project developed for learning and teaching Bokeh interactive plotting!

Bokeh-Python-Visualization A Bokeh project developed for learning and teaching Bokeh interactive plotting! See my medium blog posts about making bokeh

Will Koehrsen 350 Dec 05, 2022
Standardized plots and visualizations in Python

Standardized plots and visualizations in Python pltviz is a Python package for standardized visualization. Routine and novel plotting approaches are f

Andrew Tavis McAllister 0 Jul 09, 2022
A tool for creating SVG timelines from simple JSON input.

A tool for creating SVG timelines from simple JSON input.

Jason Reisman 432 Dec 30, 2022
A small timeseries transformation API built on Flask and Pandas

#Mcflyin ###A timeseries transformation API built on Pandas and Flask This is a small demo of an API to do timeseries transformations built on Flask a

Rob Story 84 Mar 25, 2022
The implementation of the paper "HIST: A Graph-based Framework for Stock Trend Forecasting via Mining Concept-Oriented Shared Information".

The HIST framework for stock trend forecasting The implementation of the paper "HIST: A Graph-based Framework for Stock Trend Forecasting via Mining C

Wentao Xu 111 Jan 03, 2023
Analysis and plotting for motor/prop/ESC characterization, thrust vs RPM and torque vs thrust

esc_test This is a Python package used to plot and analyze data collected for the purpose of characterizing a particular propeller, motor, and ESC con

Alex Spitzer 1 Dec 28, 2021
The official colors of the FAU as matplotlib/seaborn colormaps

FAU - Colors The official colors of Friedrich-Alexander-Universität Erlangen-Nürnberg (FAU) as matplotlib / seaborn colormaps. We support the old colo

Machine Learning and Data Analytics Lab FAU 9 Sep 05, 2022
Bokeh Plotting Backend for Pandas and GeoPandas

Pandas-Bokeh provides a Bokeh plotting backend for Pandas, GeoPandas and Pyspark DataFrames, similar to the already existing Visualization feature of

Patrik Hlobil 822 Jan 07, 2023
HW 02 for CS40 - matplotlib practice

HW 02 for CS40 - matplotlib practice project instructions https://github.com/mikeizbicki/cmc-csci040/tree/2021fall/hw_02 Drake Lyric Analysis Bar Char

13 Oct 27, 2021
This is a super simple visualization toolbox (script) for transformer attention visualization ✌

Trans_attention_vis This is a super simple visualization toolbox (script) for transformer attention visualization ✌ 1. How to prepare your attention m

Mingyu Wang 3 Jul 09, 2022
Fast 1D and 2D histogram functions in Python

About Sometimes you just want to compute simple 1D or 2D histograms with regular bins. Fast. No nonsense. Numpy's histogram functions are versatile, a

Thomas Robitaille 237 Dec 18, 2022
Generate "Jupiter" plots for circular genomes

jupiter Generate "Jupiter" plots for circular genomes Description Python scripts to generate plots from ViennaRNA output. Written in "pidgin" python w

Robert Edgar 2 Nov 29, 2021
An intuitive library to add plotting functionality to scikit-learn objects.

Welcome to Scikit-plot Single line functions for detailed visualizations The quickest and easiest way to go from analysis... ...to this. Scikit-plot i

Reiichiro Nakano 2.3k Dec 31, 2022
Visualize the bitcoin blockchain from your local node

Project Overview A new feature in Bitcoin Core 0.20 allows users to dump the state of the blockchain (the UTXO set) using the command dumptxoutset. I'

18 Sep 11, 2022
Cartopy - a cartographic python library with matplotlib support

Cartopy is a Python package designed to make drawing maps for data analysis and visualisation easy. Table of contents Overview Get in touch License an

1.2k Jan 01, 2023