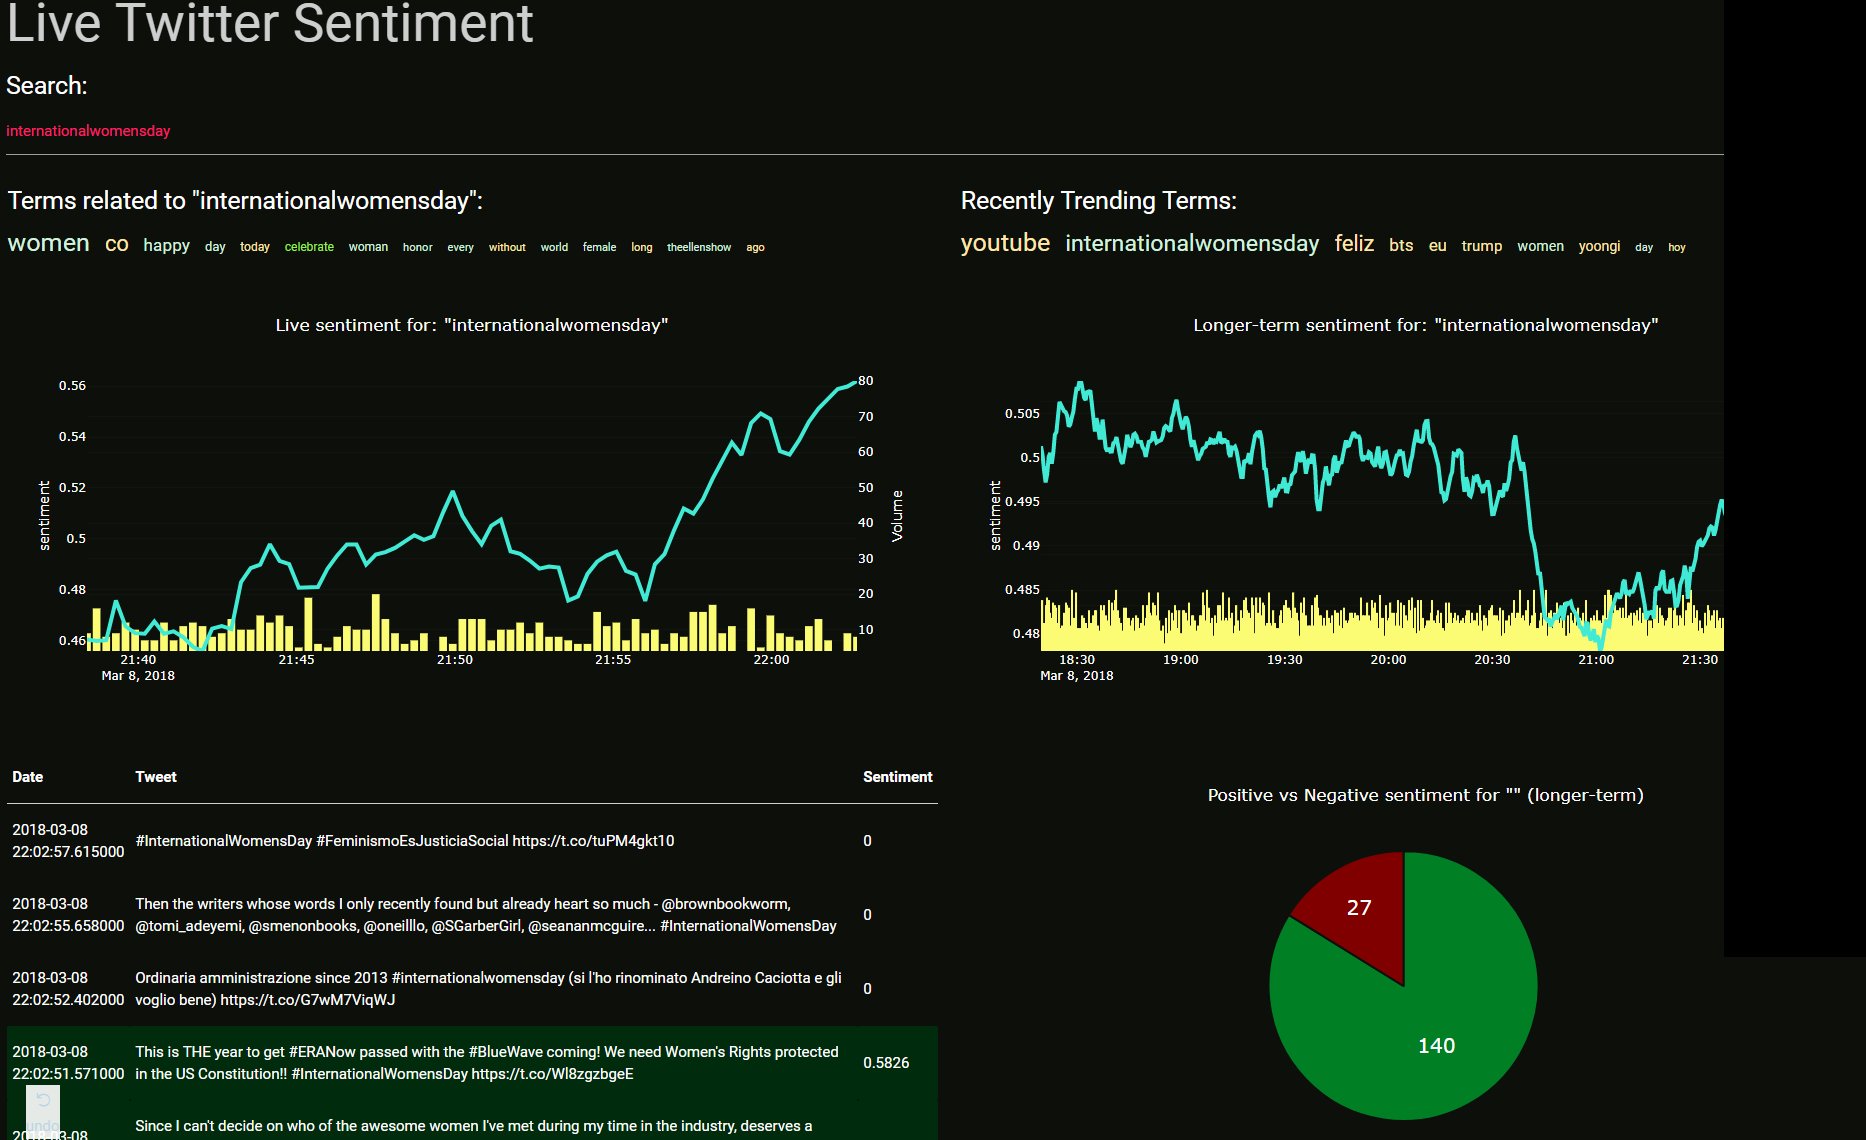
Sentiment Analysis application created with Python and Dash, hosted at socialsentiment.net

Overview

Social Sentiment Dash Application

Live-streaming sentiment analysis application created with Python and Dash, hosted at SocialSentiment.net.

application example

Dash Tutorials

This application was created in conjunction with the Dash tutorial series.

Repo Contents:

  • dash_mess.py - This is currently the main front-end application code. Contains the dash application layouts, logic for graphs, interfaces with the database...etc. Name is descriptive of the overall state of code :) ...this code is setup to run on a flask instance. If you want to clone this and run it locally, you will be using the dev_server.py
  • dev_server.py - If you wish to run this application locally, on the dev server, run via this instead.
  • twitter_stream.py - This should run in the background of your application. This is what streams tweets from Twitter, storing them into the sqlite database, which is what the dash_mess.py file interfaces with.
  • config.py - Meant for many configurations, but right now it just contains stop words. Words we don't intend to ever count in the "trending"
  • cache.py - For caching purposes in effort to get things to run faster.
  • db-truncate.py - A script to truncate the infinitely-growing sqlite database. You will get about 3.5 millionish tweets per day, depending on how fast you can process. You can keep these, but, as the database grows, search times will dramatically suffer.

Quick start

  • Clone repo
  • install requirements.txt using pip install -r requirements.txt
  • Fill in your Twitter App credentials to twitter_stream.py. Go to apps.twitter.com to set that up if you need to.
  • Run twitter_stream.py to build database
  • If you're using this locally, you can run the application with the dev_server.py script. If you want to deploy this to a webserver, see my deploying Dash application tutorial
  • You might need the latest version of sqlite.
sudo add-apt-repository ppa:jonathonf/backports
sudo apt-get update && sudo apt-get install sqlite3
  • Consider running the db-truncate.py from time to time (or via a cronjob), to keep the database reasonably sized. In its current state, the database really doesn't need to store more than 2-3 days of data most likely.

Tips for Running on Server

  • You can use Gunicorn to run the server
gunicorn dash_mess:server -b 0.0.0.0:80 -w 4

Todo

Want to help contribute???

  • Code is ugly. Low hanging fruit is just making the code not so ugly. Up to this point, I've just been in "make it work" mode.
  • App is ugly. I am not a designer. This app is prettttttyyyyyy gross. Think you have a better design? Halp.
  • Click-able related terms and trending terms would be nice. I tried, but failed at this. It'd be cool to see a related term, and be able to just click on it, and this becomes the new searched term, for example.
  • The interactive search is cool, but also does a search in the database per-character. It would be nice if it didn't search per key-press. Not sure I want a search button, I like the streamlined interactivity, but maybe wait 0.2 seconds or something without any new keypresses to perform the search? Something like that might help with speeds. I really do not know the best option here, I just know this isn't idea.
  • Other manipulations or ideas for interactivity? Feel free to show them in a PR.

Credits

The speed of the application, especially with a database with 10's of millions of records is thanks entirely to Daniel Kukiela who helped us to convert from regular sqlite to using fts, helping with the queries, new database structure, caching, and more.
Owner
Harrison
Harrison
python partial dependence plot toolbox

PDPbox python partial dependence plot toolbox Motivation This repository is inspired by ICEbox. The goal is to visualize the impact of certain feature

Li Jiangchun 723 Jan 07, 2023
clock_plot provides a simple way to visualize timeseries data, mapping 24 hours onto the 360 degrees of a polar plot

clock_plot clock_plot provides a simple way to visualize timeseries data mapping 24 hours onto the 360 degrees of a polar plot. For usage, please see

12 Aug 24, 2022
Frbmclust - Clusterize FRB profiles using hierarchical clustering, plot corresponding parameters distributions

frbmclust Getting Started Clusterize FRB profiles using hierarchical clustering,

3 May 06, 2022
Create HTML profiling reports from pandas DataFrame objects

Pandas Profiling Documentation | Slack | Stack Overflow Generates profile reports from a pandas DataFrame. The pandas df.describe() function is great

10k Jan 01, 2023
A Python wrapper of Neighbor Retrieval Visualizer (NeRV)

PyNeRV A Python wrapper of the dimensionality reduction algorithm Neighbor Retrieval Visualizer (NeRV) Compile Set up the paths in Makefile then make.

2 Aug 29, 2021
A Bokeh project developed for learning and teaching Bokeh interactive plotting!

Bokeh-Python-Visualization A Bokeh project developed for learning and teaching Bokeh interactive plotting! See my medium blog posts about making bokeh

Will Koehrsen 350 Dec 05, 2022
Main repository for Vispy

VisPy: interactive scientific visualization in Python Main website: http://vispy.org VisPy is a high-performance interactive 2D/3D data visualization

vispy 3k Jan 03, 2023
A programming language built on top of Python to easily allow Swahili speakers to get started with programming without ever knowing English

pyswahili A programming language built over Python to easily allow swahili speakers to get started with programming without ever knowing english pyswa

Jordan Kalebu 72 Dec 15, 2022
Simulation du problème de Monty Hall avec Python et matplotlib

Le problème de Monty Hall C'est un jeu télévisé où il y a trois portes sur le plateau de jeu. Seule une de ces portes cache un trésor. Il n'y a rien d

ETCHART YANG 1 Jan 06, 2022
Tandem Mass Spectrum Prediction with Graph Transformers

MassFormer This is the original implementation of MassFormer, a graph transformer for small molecule MS/MS prediction. Check out the preprint on arxiv

Röst Lab 13 Oct 27, 2022
Peloton Stats to Google Sheets with Data Visualization through Seaborn and Plotly

Peloton Stats to Google Sheets with Data Visualization through Seaborn and Plotly Problem: 2 peloton users were looking for a way to track their metri

9 Jul 22, 2022
An intuitive library to add plotting functionality to scikit-learn objects.

Welcome to Scikit-plot Single line functions for detailed visualizations The quickest and easiest way to go from analysis... ...to this. Scikit-plot i

Reiichiro Nakano 2.3k Dec 31, 2022
Fast 1D and 2D histogram functions in Python

About Sometimes you just want to compute simple 1D or 2D histograms with regular bins. Fast. No nonsense. Numpy's histogram functions are versatile, a

Thomas Robitaille 237 Dec 18, 2022
Attractors is a package for simulation and visualization of strange attractors.

attractors Attractors is a package for simulation and visualization of strange attractors. Installation The simplest way to install the module is via

Vignesh M 45 Jul 31, 2022
Small project to recursively calculate and plot each successive order of the Hilbert Curve

hilbert-curve Small project to recursively calculate and plot each successive order of the Hilbert Curve. After watching 3Blue1Brown's video on Hilber

Stefan Mejlgaard 2 Nov 15, 2021
UNMAINTAINED! Renders beautiful SVG maps in Python.

Kartograph is not maintained anymore As you probably already guessed from the commit history in this repo, Kartograph.py is not maintained, which mean

1k Dec 09, 2022
Project coded in Python using Pandas to look at changes in chase% for batters facing a pitcher first time through the order vs. thrid time

Project coded in Python using Pandas to look at changes in chase% for batters facing a pitcher first time through the order vs. thrid time

Jason Kraynak 1 Jan 07, 2022
A small timeseries transformation API built on Flask and Pandas

#Mcflyin ###A timeseries transformation API built on Pandas and Flask This is a small demo of an API to do timeseries transformations built on Flask a

Rob Story 84 Mar 25, 2022
100 Days of Code The Complete Python Pro Bootcamp for 2022

100-Day-With-Python 100 Days of Code - The Complete Python Pro Bootcamp for 2022. In this course, I spend with python language over 100 days, and I up

Rajdip Das 8 Jun 22, 2022
https://there.oughta.be/a/macro-keyboard

inkkeys Details and instructions can be found on https://there.oughta.be/a/macro-keyboard In contrast to most of my other projects, I decided to put t

Sebastian Staacks 209 Dec 21, 2022