Epagneul is a tool to visualize and investigate windows event logs

Overview

Vue logo

epagneul

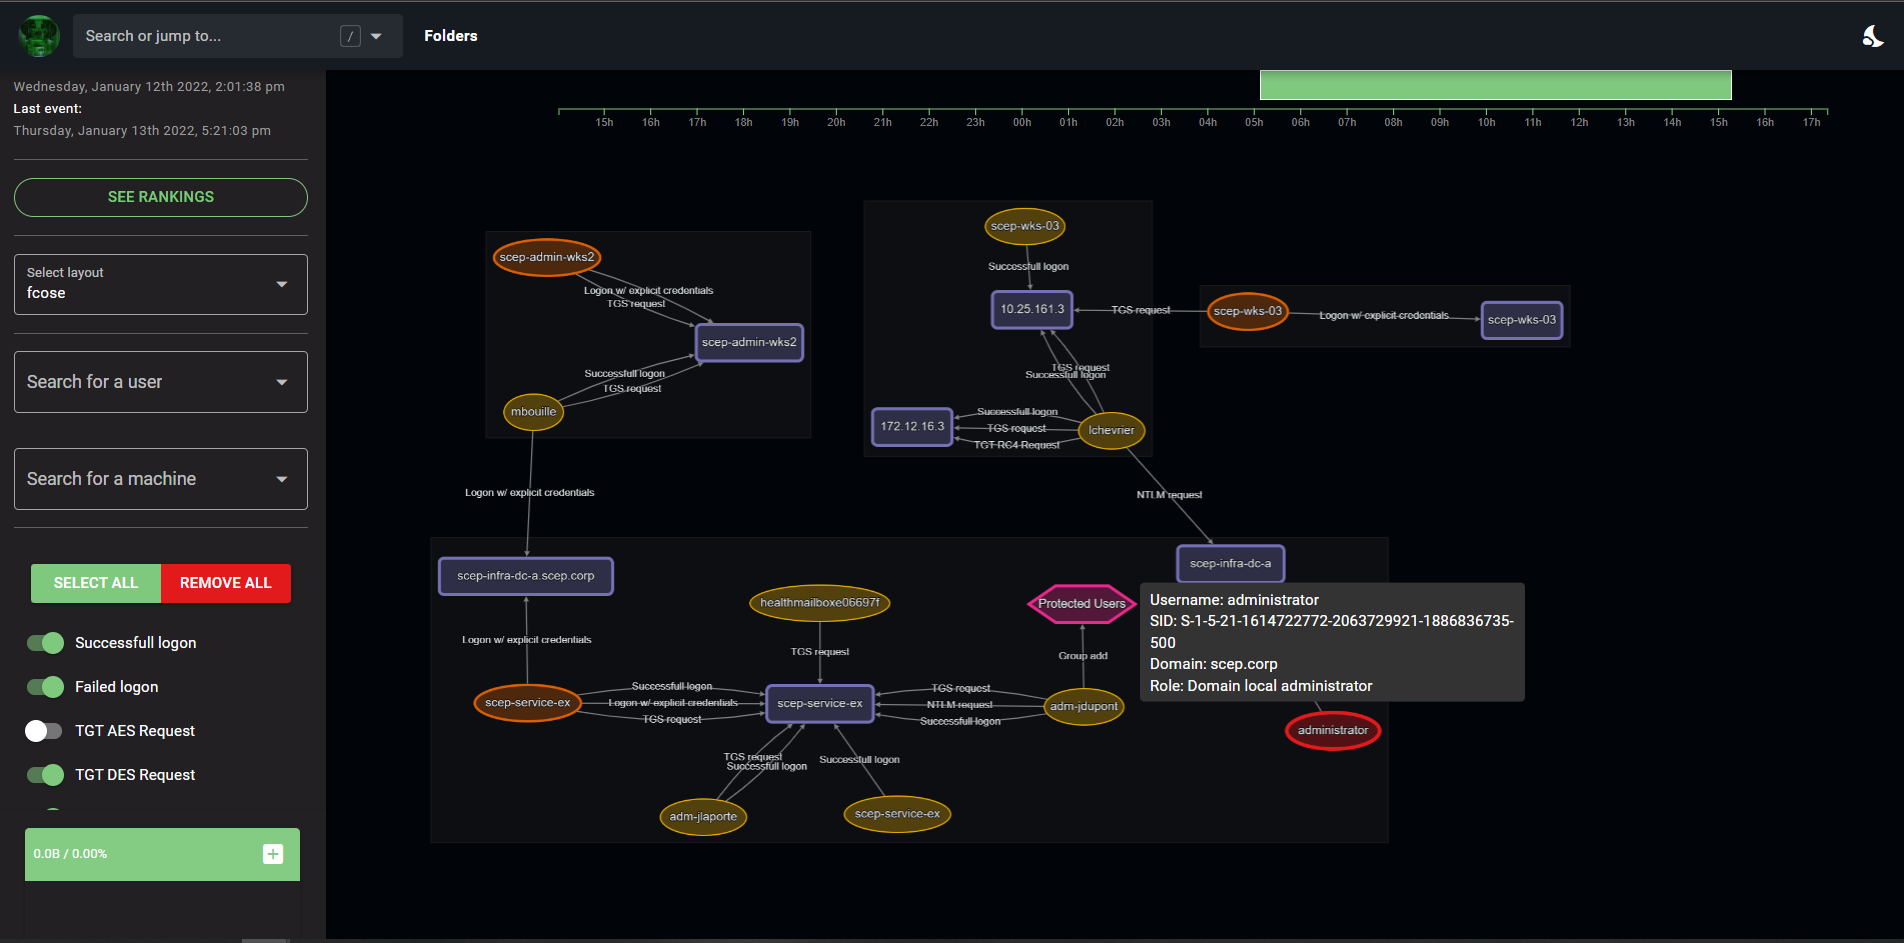
Epagneul is a tool to visualize and investigate windows event logs.

layout

Deployment

Requires docker and docker-compose to be installed.

Installing

make

Offline deployment

On a machine connected to internet, build an offline release:

make release

This will create a release folder containing ready to go docker images. Copy the project to your air gapped machine then run:

make load
make

This will install:

  • epagneul web UI (port 8080)
  • epagneul backend (port 8000)
  • neo4j (port 7474)

When installing on a server, you need to modify VUE_APP_BASE_URL=http:// :8000/api in your docker-compose.yaml.

todos

  • Better SID corelations
  • add edge tips
  • Label propagation algorithm
  • PageRank
  • Add missing events IDs (sysmon)
  • Proper conversion of known SIDS / security principals, ...
  • hidden markov chains
  • Display a timeline of logons / at least a summary graph
  • check out: https://github.com/ahmedkhlief/APT-Hunter
  • Import data from ELK / splunk
  • detect communities using louvain
  • Document evtx filtering method using filter 3,4648,4624,4625,4672,4768,4769,4771,4776,4728,4732,4756

Known bugs

  • The count value on edges does not update based on the selected timeline

References:

Built With

  • Vue.js - The web framework used
  • Cytoscape.js - Library used for graph visualisation and analysis
  • d3 - Used to display the timeline
  • neo4j - Backend database
  • evtx - Parser for the windows XML EventLog format

Authors

Owner
jurelou
jurelou
:bowtie: Create a dashboard with python!

Installation | Documentation | Gitter Chat | Google Group Bowtie Introduction Bowtie is a library for writing dashboards in Python. No need to know we

Jacques Kvam 753 Dec 22, 2022
Generate visualizations of GitHub user and repository statistics using GitHub Actions.

GitHub Stats Visualization Generate visualizations of GitHub user and repository statistics using GitHub Actions. This project is currently a work-in-

Aditya Thakekar 1 Jan 11, 2022
Simple CLI python app to show a stocks graph performance. Made with Matplotlib and Tiingo.

stock-graph-python Simple CLI python app to show a stocks graph performance. Made with Matplotlib and Tiingo. Tiingo API Key You will need to add your

Toby 3 May 14, 2022
Graphical visualizer for spectralyze by Lauchmelder23

spectralyze visualizer Graphical visualizer for spectralyze by Lauchmelder23 Install Install matplotlib and ffmpeg. Put ffmpeg.exe in same folder as v

Matthew 1 Dec 21, 2021
This is a sorting visualizer made with Tkinter.

Sorting-Visualizer This is a sorting visualizer made with Tkinter. Make sure you've installed tkinter in your system to use this visualizer pip instal

Vishal Choubey 7 Jul 06, 2022
The open-source tool for building high-quality datasets and computer vision models

The open-source tool for building high-quality datasets and computer vision models. Website • Docs • Try it Now • Tutorials • Examples • Blog • Commun

Voxel51 2.4k Jan 07, 2023
Dimensionality reduction in very large datasets using Siamese Networks

ivis Implementation of the ivis algorithm as described in the paper Structure-preserving visualisation of high dimensional single-cell datasets. Ivis

beringresearch 284 Jan 01, 2023
Lumen provides a framework for visual analytics, which allows users to build data-driven dashboards from a simple yaml specification

Lumen project provides a framework for visual analytics, which allows users to build data-driven dashboards from a simple yaml specification

HoloViz 120 Jan 04, 2023
I'm doing Genuary, an aritifiacilly generated month to build code that make beautiful things

Genuary 2022 I'm doing Genuary, an aritifiacilly generated month to build code that make beautiful things. Every day there is a new prompt for making

Joaquín Feltes 1 Jan 10, 2022
Streamlit dashboard examples - Twitter cashtags, StockTwits, WSB, Charts, SQL Pattern Scanner

streamlit-dashboards Streamlit dashboard examples - Twitter cashtags, StockTwits, WSB, Charts, SQL Pattern Scanner Tutorial Video https://ww

122 Dec 21, 2022
This is a Boids Simulation, written in Python with Pygame.

PyNBoids A Python Boids Simulation This is a Boids simulation, written in Python3, with Pygame2 and NumPy. To use: Save the pynboids_sp.py file (and n

Nik 17 Dec 18, 2022
PyFlow is a general purpose visual scripting framework for python

PyFlow is a general purpose visual scripting framework for python. State Base structure of program implemented, such things as packages disco

1.8k Jan 07, 2023
Plotly Dash Command Line Tools - Easily create and deploy Plotly Dash projects from templates

🛠️ dash-tools - Create and Deploy Plotly Dash Apps from Command Line | | | | | Create a templated multi-page Plotly Dash app with CLI in less than 7

Andrew Hossack 50 Dec 30, 2022
GD-UltraHack - A Mod Menu for Geometry Dash. Specifically a MegahackV5 clone in Python. Only for Windows

GD UltraHack: The Mod Menu that Nobody asked for. This is a mod menu for the gam

zeo 1 Jan 05, 2022
Make your BSC transaction simple.

bsc_trade_history Make your BSC transaction simple. 中文ReadMe Background: inspired by debank ,Practice my hands on this small project Blog:Crypto-BscTr

foolisheddy 7 Jul 06, 2022
Personal IMDB Graphs with Bokeh

Personal IMDB Graphs with Bokeh Do you like watching movies and also rate all of them in IMDB? Would you like to look at your IMDB stats based on your

2 Dec 15, 2021
Blender addon that creates a temporary window of any type from the 3D View.

CreateTempWindow2.8 Blender addon that creates a temporary window of any type from the 3D View. Features Can the following window types: 3D View Graph

3 Nov 27, 2022
Decision Border Visualizer for Classification Algorithms

dbv Decision Border Visualizer for Classification Algorithms Project description A python package for Machine Learning Engineers who want to visualize

Sven Eschlbeck 1 Nov 01, 2021
visualize_ML is a python package made to visualize some of the steps involved while dealing with a Machine Learning problem

visualize_ML visualize_ML is a python package made to visualize some of the steps involved while dealing with a Machine Learning problem. It is build

Ayush Singh 164 Dec 12, 2022
Sentiment Analysis application created with Python and Dash, hosted at socialsentiment.net

Social Sentiment Dash Application Live-streaming sentiment analysis application created with Python and Dash, hosted at SocialSentiment.net. Dash Tuto

Harrison 456 Dec 25, 2022