Functions for easily making publication-quality figures with matplotlib.

Overview

Data-viz utils 📈

Functions for data visualization in matplotlib

📚 API

Can be installed using pip install dvu and then imported with import dvu.

You can also just copy the relatively short source code for the functions (easily viewable here).

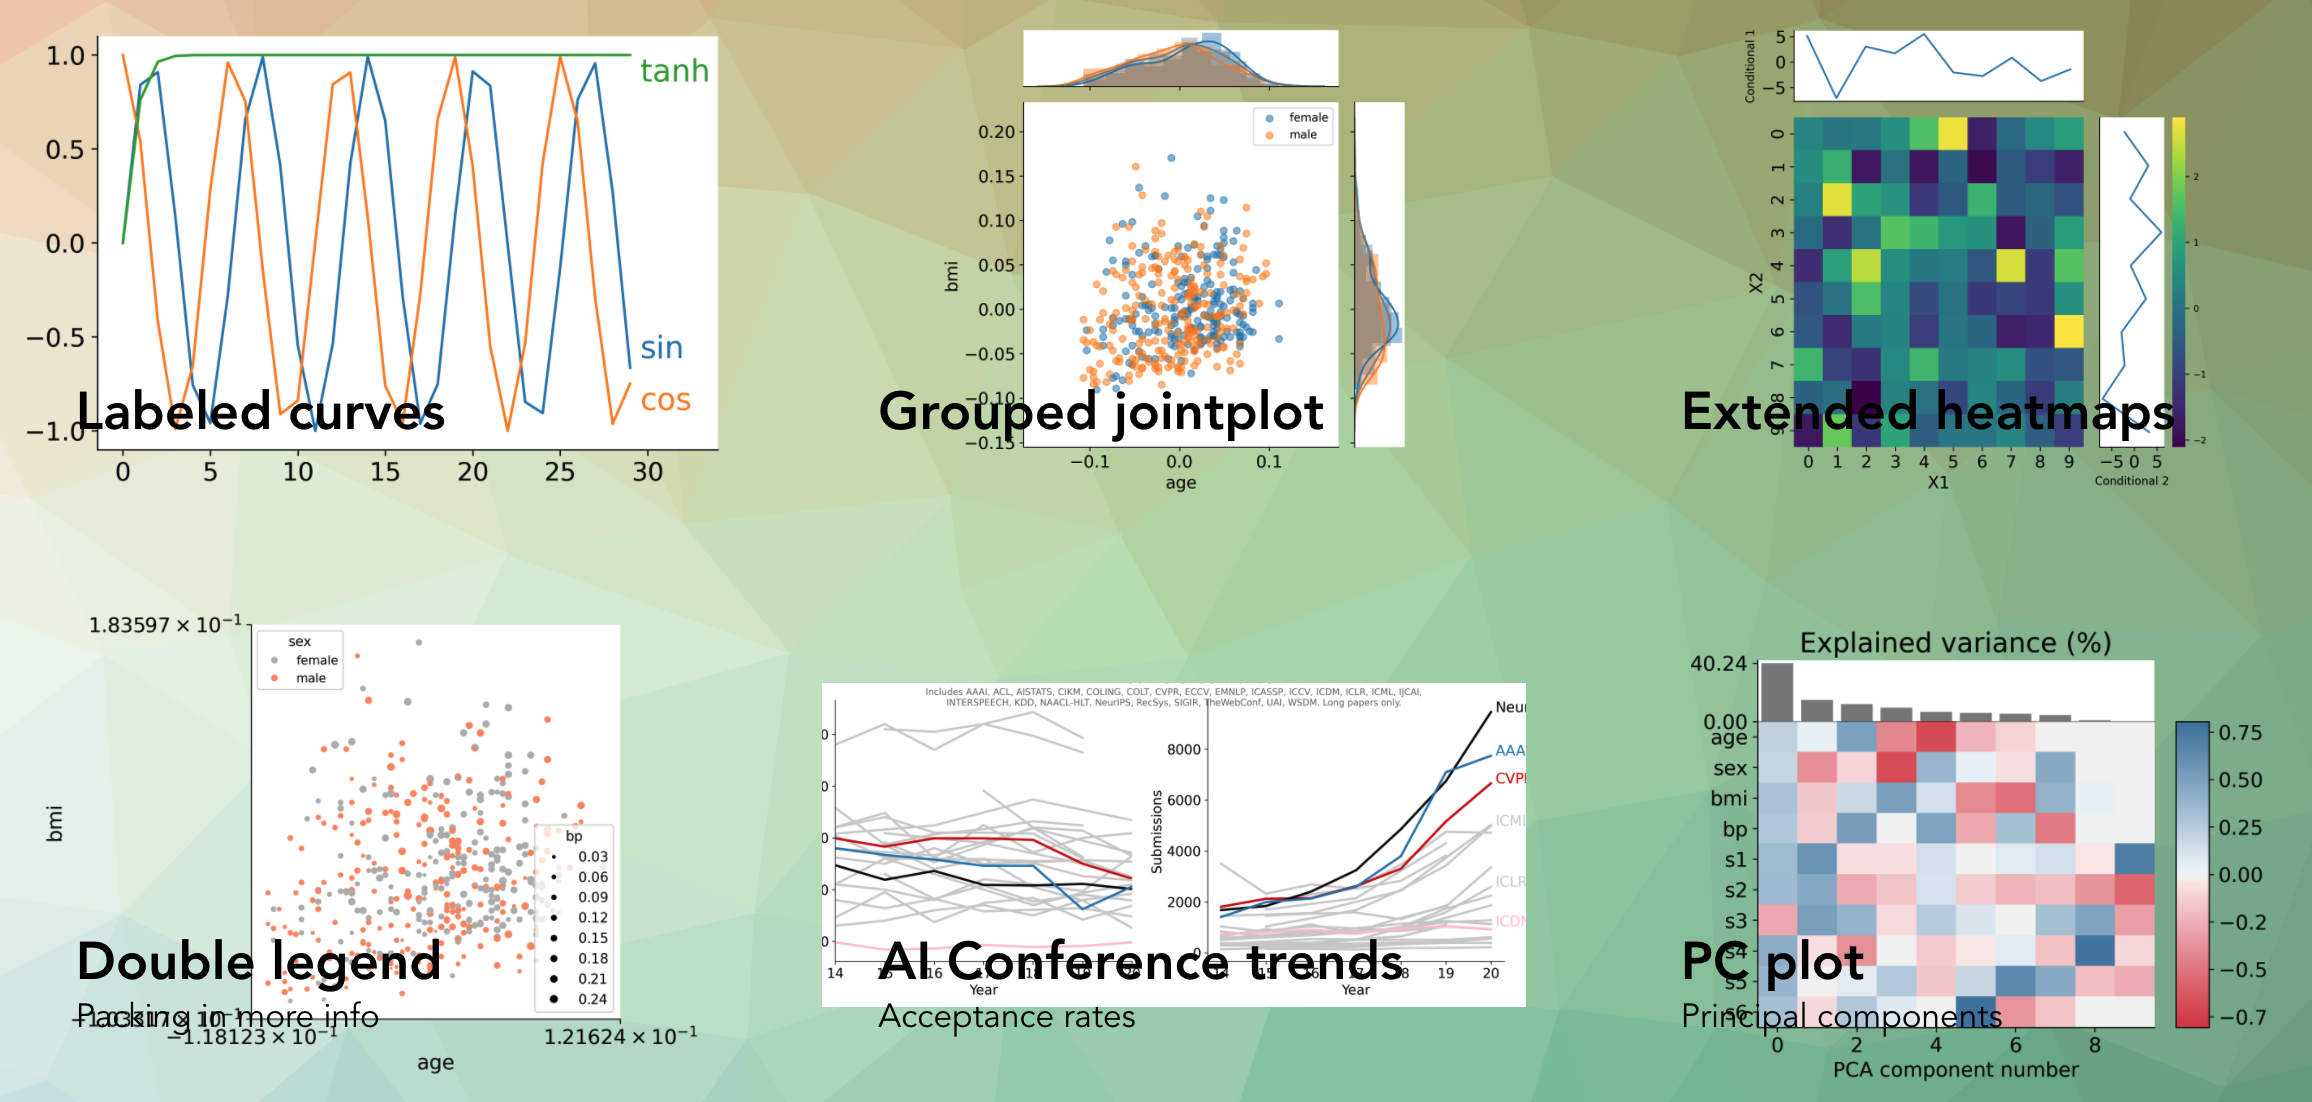
Helps create a bunch of different plots such as these:

One particularly useful function is dvu.line_legend() which replaces a typical matplotlib legend with labels for each line:

Using plt.legend() Using dvu.line_legend()
plt_legend dvu_legend

Another one is dvu.invert_plot() which can be called after generating a plot to invert everything besides the line colors

Original plot After dvu.invert_plot()
plt_legend dvu_legend

Reference

Owner
Chandan Singh
Working on interpretable machine learning across domains 🧠⚕️🦠 Let's do good with models.
Chandan Singh
python partial dependence plot toolbox

PDPbox python partial dependence plot toolbox Motivation This repository is inspired by ICEbox. The goal is to visualize the impact of certain feature

Li Jiangchun 723 Jan 07, 2023
Graphical display tools, to help students debug their class implementations in the Carcassonne family of projects

carcassonne_tools Graphical display tools, to help students debug their class implementations in the Carcassonne family of projects NOTE NOTE NOTE The

1 Nov 08, 2021
Resources for teaching & learning practical data visualization with python.

Practical Data Visualization with Python Overview All views expressed on this site are my own and do not represent the opinions of any entity with whi

Paul Jeffries 98 Sep 24, 2022
NumPy and Pandas interface to Big Data

Blaze translates a subset of modified NumPy and Pandas-like syntax to databases and other computing systems. Blaze allows Python users a familiar inte

Blaze 3.1k Jan 01, 2023
Set of matplotlib operations that are not trivial

Matplotlib Snippets This repository contains a set of matplotlib operations that are not trivial. Histograms Histogram with bins adapted to log scale

Raphael Meudec 1 Nov 15, 2021
A Python Library for Self Organizing Map (SOM)

SOMPY A Python Library for Self Organizing Map (SOM) As much as possible, the structure of SOM is similar to somtoolbox in Matlab. It has the followin

Vahid Moosavi 497 Dec 29, 2022
649 Pokémon palettes as CSVs, with a Python lib to turn names/IDs into palettes, or MatPlotLib compatible ListedColormaps.

PokePalette 649 Pokémon, broken down into CSVs of their RGB colour palettes. Complete with a Python library to convert names or Pokédex IDs into eithe

11 Dec 05, 2022
Dipto Chakrabarty 7 Sep 06, 2022
Create SVG drawings from vector geodata files (SHP, geojson, etc).

SVGIS Create SVG drawings from vector geodata files (SHP, geojson, etc). SVGIS is great for: creating small multiples, combining lots of datasets in a

Neil Freeman 78 Dec 09, 2022
GD-UltraHack - A Mod Menu for Geometry Dash. Specifically a MegahackV5 clone in Python. Only for Windows

GD UltraHack: The Mod Menu that Nobody asked for. This is a mod menu for the gam

zeo 1 Jan 05, 2022
The plottify package is makes matplotlib plots more legible

plottify The plottify package is makes matplotlib plots more legible. It's a thin wrapper around matplotlib that automatically adjusts font sizes, sca

Andy Jones 97 Nov 04, 2022
I'm doing Genuary, an aritifiacilly generated month to build code that make beautiful things

Genuary 2022 I'm doing Genuary, an aritifiacilly generated month to build code that make beautiful things. Every day there is a new prompt for making

Joaquín Feltes 1 Jan 10, 2022
Create Badges with stats of Scratch User, Project and Studio. Use those badges in Github readmes, etc.

Scratch-Stats-Badge Create customized Badges with stats of Scratch User, Studio or Project. Use those badges in Github readmes, etc. Examples Document

Siddhesh Chavan 5 Aug 28, 2022
Flow-based visual scripting for Python

A simple visual node editor for Python Ryven combines flow-based visual scripting with Python. It gives you absolute freedom for your nodes and a simp

Leon Thomm 3.1k Jan 06, 2023
Piglet-shaders - PoC of custom shaders for Piglet

Piglet custom shader PoC This is a PoC for compiling Piglet fragment shaders usi

6 Mar 10, 2022
Learn Basic to advanced level Data visualisation techniques from this Repository

Data visualisation Hey, You can learn Basic to advanced level Data visualisation techniques from this Repository. Data visualization is the graphic re

Shashank dwivedi 16 Jan 03, 2023
GDSHelpers is an open-source package for automatized pattern generation for nano-structuring.

GDSHelpers GDSHelpers in an open-source package for automatized pattern generation for nano-structuring. It allows exporting the pattern in the GDSII-

Helge Gehring 76 Dec 16, 2022
A blender import/export system for Defold

defold-blender-export A Blender export system for the Defold game engine. Setup Notes There are no exhaustive documents for this tool yet. Its just no

David Lannan 27 Dec 30, 2022
Learn Data Science with focus on adding value with the most efficient tech stack.

DataScienceWithPython Get started with Data Science with Python An engaging journey to become a Data Scientist with Python TL;DR Download all Jupyter

Learn Python with Rune 110 Dec 22, 2022
Plotting library for IPython/Jupyter notebooks

bqplot 2-D plotting library for Project Jupyter Introduction bqplot is a 2-D visualization system for Jupyter, based on the constructs of the Grammar

3.4k Dec 29, 2022